spectrogram
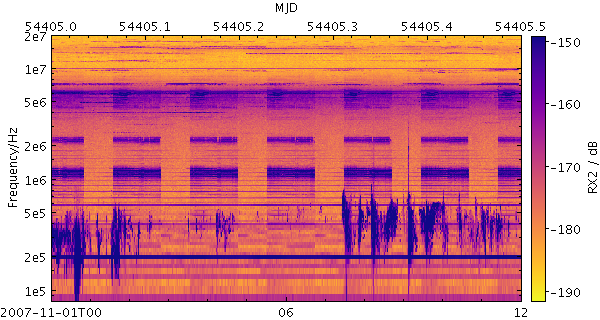
Plots spectrograms. A spectrogram is a sequence of spectra plotted as vertical 1-d images, each one plotted at a different horizontal coordinate.
This specialised layer is only available for
time plots.
The way that data values are mapped to colours is usually controlled by options at the level of the plot itself, rather than by per-layer configuration.
Usage Overview:
   layerN=spectrogram scalespecN=true|false tN=<time-expr>
                      ttypeN=DecYear|MJD|JD|Unix|Iso8601 spectrumN=<array-expr>
                      twidthN=<num-expr> inN=<table> ifmtN=<in-format>
                      istreamN=true|false icmdN=<cmds>
All the parameters listed here
affect only the relevant layer,
identified by the suffix
N.
Example:
   stilts plot2time layer1=spectrogram in1=LRS_NPW_V010_20071101.cdf t1=epoch spectrum1=RX2
                    t2func=mjd t2label=MJD
                    auxfunc=linear auxmap=plasma auxclip=0,1
                    xpix=600 ypix=320
                    tmin=2007-11-01T00 tmax=2007-11-01T12
                    yscale=log ylabel=Frequency/Hz ymin=8e4 ymax=2e7
icmdN = <cmds> (ProcessingStep[])
inN.
The value of this parameter is one or more of the filter
commands described in Section 6.1.
If more than one is given, they must be separated by
semicolon characters (";").
This parameter can be repeated multiple times on the same
command line to build up a list of processing steps.
The sequence of commands given in this way
defines the processing pipeline which is performed on the table.
Commands may alternatively be supplied in an external file,
by using the indirection character '@'.
Thus a value of "@filename"
causes the file filename to be read for a list
of filter commands to execute. The commands in the file
may be separated by newline characters and/or semicolons,
and lines which are blank or which start with a
'#' character are ignored.
A backslash character '\' at the end of a line
joins it with the following line.
ifmtN = <in-format> (String)
inN.
The known formats are listed in Section 5.1.1.
This flag can be used if you know what format your
table is in.
If it has the special value
(auto) (the default),
then an attempt will be
made to detect the format of the table automatically.
This cannot always be done correctly however, in which case
the program will exit with an error explaining which
formats were attempted.
This parameter is ignored for scheme-specified tables.
[Default: (auto)]
inN = <table> (StarTable)
-",
meaning standard input.
In this case the input format must be given explicitly
using the ifmtN
parameter.
Note that not all formats can be streamed in this way.:<scheme-name>:<scheme-args>.<" character at the start,
or a "|" character at the end
("<syscmd" or
"syscmd|").
This executes the given pipeline and reads from its
standard output.
This will probably only work on unix-like systems.istreamN = true|false (Boolean)
inN parameter
will be read as a stream.
It is necessary to give the
ifmtN parameter
in this case.
Depending on the required operations and processing mode,
this may cause the read to fail (sometimes it is necessary
to read the table more than once).
It is not normally necessary to set this flag;
in most cases the data will be streamed automatically
if that is the best thing to do.
However it can sometimes result in less resource usage when
processing large files in certain formats (such as VOTable).
This parameter is ignored for scheme-specified tables.
[Default: false]
scalespecN = true|false (Boolean)
If this flag is set false, or if no suitable array can be found, the vertical axis just represents channel indices and so is labelled from 0 to the number of channels per spectrum.
This configuration item is somewhat experimental; the details of how the spectral axis is configured may change in future releases.
[Default: true]
spectrumN = <array-expr> (String)
The value is an array-valued algebraic expression based on column names as described in Section 10. Some of the functions in the Arrays class may be useful here.
tN = <time-expr> (String)
The value is a Time value algebraic expression based on column names as described in Section 10.
ttypeN = DecYear|MJD|JD|Unix|Iso8601 (TimeMapper)
tN is supplied.
Options are:
DecYear: Years since 0 ADMJD: Modified Julian DateJD: Julian DayUnix: Seconds since midnight 1 Jan 1970Iso8601: ISO 8601 stringtN value.
twidthN = <num-expr> (String)
The value is a numeric algebraic expression based on column names as described in Section 10.