Next Previous Up Contents
Next: 2D Plot (old-style)
Up: Histogram (old-style)
Previous: Histogram (old-style)
The bins in a histogram can be represented in many different ways.
A representation of how a bar will be displayed is shown on a button
to the right of the name of each visible subset, at the bottom right
of the histogram window. If you click this button the following
dialogue will pop up which enables you to change the appearance.
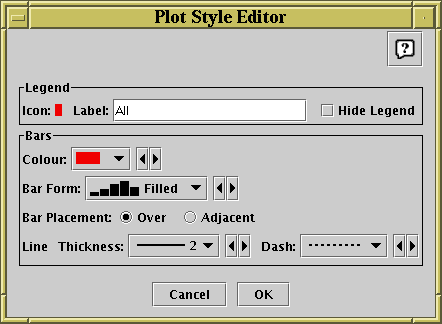
Style editor dialogue for histogram bars
The Legend box defines how the selected set will
be identified in the legend which appears alongside the plot
(though the legend will only be visible if Show Legend
( ) is on):
-
Icon
- Displays the icon which will be shown to identify the points in
the selected set. Its appearance depends on the selections you
make in the rest of this dialogue window.
-
Label
- Gives the name written in the legend to label the subset.
By default this is derived from the Row Subset's name and, if it's
not part of the main dataset, the name of the dataset's tab.
You can type in a new value to change what is written in the legend.
-
Hide Legend
- If this checkbox is selected, then no entry for the selected set
will appear in the legend.
The Bins panel describes the form of the bars to be
plotted for each data set.
-
Colour
- Selects the colour for the bar or line which will represent this set.
-
Bar Form
- Selects the style of bar which will be plotted.
Available styles are filled rectangles, open rectangles, stepped lines
and spikes.
-
Bar Placement
- Selects where each bar will be placed on the X axis within the
ordinate region which it represents. There are currently two options:
Over means that it covers the whole of its range,
and Adjacent means that it covers only a proportion of
its range, so that multiple datasets plotted on the same graph don't
obscure each other (if 2 sets are plotted, the first one will take the
left half and the second will take the right half of each bin region,
and so on). In the case that there is only a single data set plotted,
it doesn't matter which of these is chosen.
-
Line Thickness
- Determines the thickness in pixels of any lines which are drawn.
Only applies to those Bar Forms which use lines rather
than solid blocks.
-
Dash
- Determines the dash style (solid, dotted, dashed or dot-dashed) for
any lines which are drawn. Only applies to those Bar Forms
which use lines rather than solid blocks.
Any changes you make in this window are reflected in the plot straight
away. If you click the OK button at the bottom, the window
will disappear and the changes remain. If you click Cancel
the window will disappear and any changes you made will be discarded.
You can also change all the plotting styles at once by using the
Bar Style menu in the histogram window.
Here you can select a standard group of styles (e.g. all filled adjacent
bars with different colours) for the plotted sets.
Next Previous Up Contents
Next: 2D Plot (old-style)
Up: Histogram (old-style)
Previous: Histogram (old-style)
TOPCAT - Tool for OPerations on Catalogues And Tables
Starlink User Note253
TOPCAT web page:
http://www.starlink.ac.uk/topcat/
Author email:
m.b.taylor@bristol.ac.uk
Mailing list:
topcat-user@jiscmail.ac.uk