The Axes control (![]() ) for the
sphere plot window has the following tabs:
) for the
sphere plot window has the following tabs:
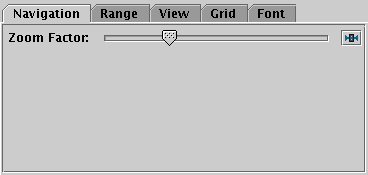
Navigation tab of the sphere Axes control
The Navigation tab controls details of how the navigation works. It has the following option:
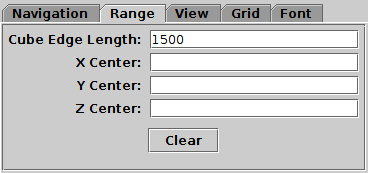
Range tab of the sphere Axes control
The Range tab provides manual configuration of the data range of the plot. Making changes to this tab will reset the visible plot range, but not vice versa - zooming and panning in the usual way will not change the settings of this panel. Any values not filled in will be determined from the data. The fields are:
The Clear button resets all the fields.
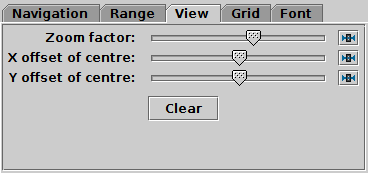
View tab of the sphere Axes control
The View tab can configure how the cube containing the data is viewed in the plot window, though it does not control the content of the cube.
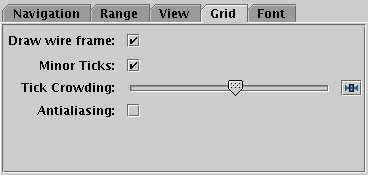
Grid tab of the sphere Axes control
The Grid tab configures the appearance of the cube wire frame enclosing the data volume.
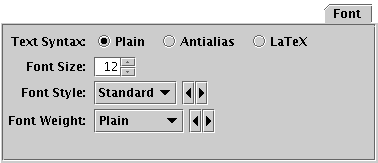
Font tab
The Font tab configures the font used for axis annotation. It also affects some other things like the legend.