Next Previous Up Contents
Next: Grid Form
Up: Plot Forms
Previous: Label Form
The Contour form ( )
plots position density contours.
These provide another way
(alongside the Auto,
Density and
Weighted shading modes)
to visualise the characteristics of overdense regions in a crowded plot.
)
plots position density contours.
These provide another way
(alongside the Auto,
Density and
Weighted shading modes)
to visualise the characteristics of overdense regions in a crowded plot.
The contours are currently drawn as pixels rather than lines,
so they don't look very beautiful in exported vector output formats
(PDF, SVG, PostScript).
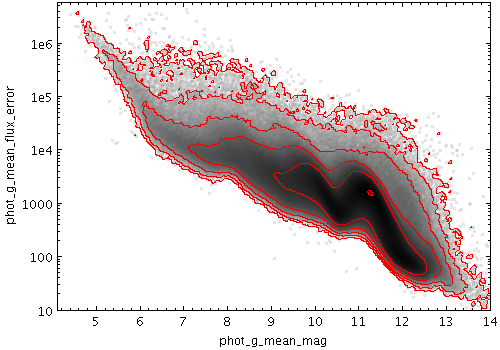
Example Contour plot
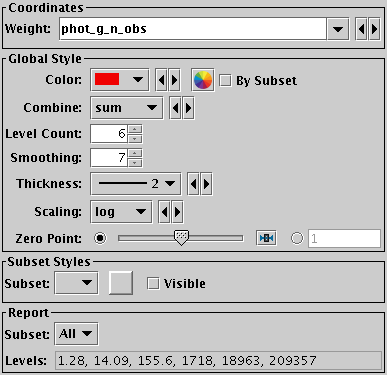
Contour form configuration panel
The configuration options are:
-
Weight
- The weighting to apply to each input sample when producing the
grid whose values are to be contoured.
If supplied this is used in conjunction with the
Combine selection.
If left blank, an effective weighting of unity is used,
and only smoothed point densities are contoured.
-
Color
- The colour of the contour lines.
If overlaid on top of other plot types that use the same colour,
you may want to change this from its default value.
-
Combine
- Defines the way that the weight values are combined
when generating the value grid for which the contours
will be plotted.
If a weighting is supplied, the most useful values are
mean which traces the
mean values of a quantity and
sum which traces the
weighted sum.
Other values such as
median
are of dubious validity because of the way that the
smoothing is done.
This value is ignored if the weighting coordinate
Weight is not set.
The available options are:
-
sum: the sum of all the combined values per bin
-
mean: the mean of the combined values
-
median:
the median of the combined values (may be slow)
-
stdev:
the sample standard deviation of the combined values
-
min: the minimum of all the combined values
-
max: the maximum of all the combined values
-
count:
the number of non-blank values per bin (weight is ignored)
-
Level Count
- The number of contours drawn.
In fact this is an upper limit; if there is not enough variation
in the plot's density, then fewer contour lines will be drawn.
-
Smoothing
- The size of the smoothing kernel applied to the density before
performing the contour determination. If set too low the contours
will be too crinkly, and if too high they will lose definition.
-
Thickness
- The thickness in pixels of contour lines.
-
Scaling
- How the smoothed density is treated before the contours levels
are determined. Options are linear, logarithmic and equal area.
-
Zero Point
- Determines the level at which the first contour (and hence all the
others, which are separated from it by a fixed amount) are drawn.
By sliding this from side to side you can sweep the contours over
the density range and get a good idea of where interesting features lie.
The plot reports the contour levels it has used:
-
Levels
- The actual values at which contours have been plotted.
This can be useful for weighted plots using with a Combine
value of mean,
but for other combinations it may not have much physical meaning.
Next Previous Up Contents
Next: Grid Form
Up: Plot Forms
Previous: Label Form
TOPCAT - Tool for OPerations on Catalogues And Tables
Starlink User Note253
TOPCAT web page:
http://www.starlink.ac.uk/topcat/
Author email:
m.b.taylor@bristol.ac.uk
Mailing list:
topcat-user@jiscmail.ac.uk