Next Previous Up Contents
Next: Histogram Form
Up: Plot Forms
Previous: SkyDensity Form
If a two-dimensional dataset represents a single-valued function,
the Fill form ( ) will fill the area underneath
the function's curve with a solid colour.
Parts of the surface which would only be partially covered
(because of rapid function variation within the width of a single pixel)
are represented using appropriate alpha-blending.
The filled area may alternatively be that above the curve
or (in some plot types) to its left or right.
) will fill the area underneath
the function's curve with a solid colour.
Parts of the surface which would only be partially covered
(because of rapid function variation within the width of a single pixel)
are represented using appropriate alpha-blending.
The filled area may alternatively be that above the curve
or (in some plot types) to its left or right.
One example of its use is to reconstruct the appearance of a
histogram plot from a set of histogram bins.
For X,Y data which is not single-valued, the result may not be very useful.
This form may be used in the
Plane or
Time plot windows.
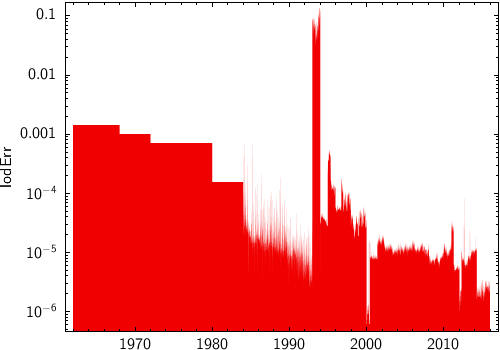
Example Fill plot
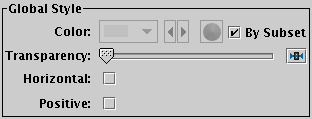
Fill form configuration panel
The configuration options are:
-
Transparency
- Adjusts the transparency of the filled area.
-
Horizontal
- Determines whether the filling is
vertical (suitable for functions of the horizontal variable)
or horizontal (suitable for functions of the vertical variable).
In the Time plot, the fill is always vertical, so this option is not
provided.
-
Positive
- Determines the directional sense of the filling.
If false, the fill is between the data points and negative
infinity along the relevant axis
(e.g. down from the data points to the bottom of the plot).
If true, the fill is in the other direction.
Next Previous Up Contents
Next: Histogram Form
Up: Plot Forms
Previous: SkyDensity Form
TOPCAT - Tool for OPerations on Catalogues And Tables
Starlink User Note253
TOPCAT web page:
http://www.starlink.ac.uk/topcat/
Author email:
m.b.taylor@bristol.ac.uk
Mailing list:
topcat-user@jiscmail.ac.uk