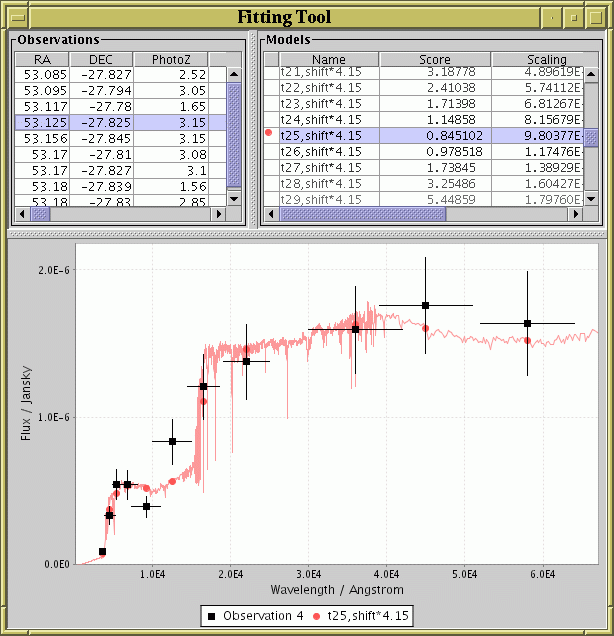
Window displayed by the gui mode of the
fit task.
Some of the tasks in Yafit provide a graphical display on the screen;
plotobs plots observational data,
plotmodel plots model data,
and the gui mode of fit
shows both.
These displays use a similar format and visual controls, as shown
in the figure.

Window displayed by the gui mode of the
fit task.
The window consists of two parts: at the top are one or more tables giving details of the model or observation data being displayed, and at the bottom is the graphical display itself. In this case the top left part shows the table of observations (one per row) and the top right part shows the table of models (one per row). In each case, the highlighted row or rows indicate which observation/model is being drawn, and you can select observations/models for display by clicking on these tables to highlight rows. Clicking on a row while holding down the CTRL button will usually add/subtract the relevant row from the display list, while doing it without CTRL will select the relevant row as the only one for display.
The continuous coloured line or lines represent model data, and the points with error bars represent observational data points. The vertical bars on each point represent the error associated with the flux at that point, and the horizontal bars represent the width of the band pass. In this case the coloured dots give the position of the Y samples taken from the model data for comparison with the observed points - this is determined from the actual model curve according to some smoothing function as determined by the parameters of the fitting task (typically, by averaging over the band pass width).
Some control over the form of the plot is available. First, you can resize the window to resize the plot. Second, you can zoom in by dragging the mouse down and to the right, or zoom back to "normal" by dragging up and left. Thirdly, by clicking with the right mouse button on the plot you are a popup menu which provides various options, including:
The graphical windows displayed by
plotobs and
plotmodel work in a similar way.