arealabel
Draws a text label near the center of each area.You can select the font, where the labels appear in relation to the point positions, and how crowded the points have to get before they are suppressed.
This is just like a normal Label plot, but the positions are taken from an Area coordinate rather than normal positional coordinates.
Usage Overview:
   layerN=arealabel texttypeN=plain|antialias|latex fontsizeN=<int-value>
                    fontstyleN=standard|serif|mono
                    fontweightN=plain|bold|italic|bold_italic
                    anchorN=west|east|north|south|center
                    colorN=<rrggbb>|red|blue|... xoffN=<pixels> yoffN=<pixels>
                    spacingN=<pixels> crowdlimitN=<n> areaN=<area-expr>
                    areatypeN=POINT|CIRCLE|POLYGON|MOC-ASCII|UNIQ|STC-S|TFCAT
                    labelN=<txt-expr> inN=<table> ifmtN=<in-format>
                    istreamN=true|false icmdN=<cmds>
All the parameters listed here
affect only the relevant layer,
identified by the suffix
N.
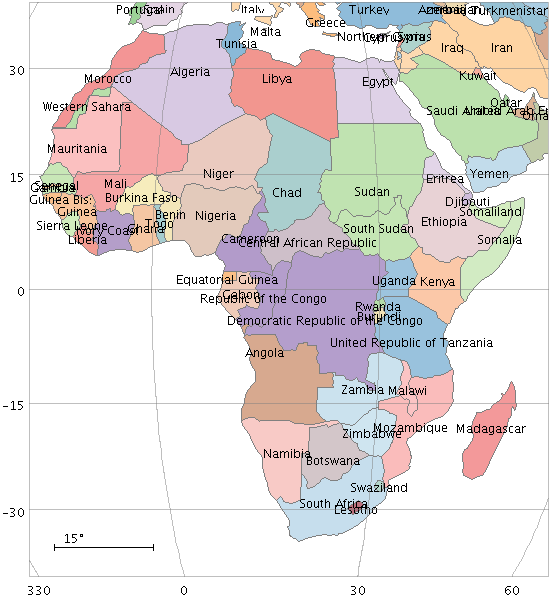
Example:
   stilts plot2sky reflectlon=false sex=false
                   clon=18 clat=0 radius=36 xpix=550 ypix=600
                   in=countries.vot
                   area=shape areatype=STC-S
                   layer_1=area polymode_1=fill
                   shading_1=aux aux_1=index opaque_1=2 layer_2=area polymode_2=outline
                   shading_2=flat color_2=grey
                   auxmap=paired auxvisible=false
                   layer_3=arealabel label_3=name anchor_3=center color_3=black
anchorN = west|east|north|south|center (Anchor)
The available options are:
west
east
north
south
center
[Default: west]
areaN = <area-expr> (String)
areatype parameter.
The value is a Area value algebraic expression based on column names as described in Section 10.
areatypeN = POINT|CIRCLE|POLYGON|MOC-ASCII|UNIQ|STC-S|TFCAT (AreaMapper)
areaN is supplied.
Options are:
POINT: 2-element array (x,y)CIRCLE: 3-element array (x, y, r)POLYGON: 2n-element array (x1,y1, x2,y2,...);
a NaN,NaN pair can be used to delimit distinct polygons.MOC-ASCII: Region description using ASCII MOC syntax;
see MOC 2.0 sec 4.3.2.
Note there are currently a few issues
with MOC plotting, especially for large pixels.UNIQ: Region description representing a single HEALPix cell
as defined by an UNIQ value, see
MOC 2.0
sec 4.3.1.STC-S: Region description using STC-S syntax;
see TAP 1.0, section 6.
Note there are some restrictions:
<frame>, <refpos> and <flavor> metadata are ignored,
polygon winding direction is ignored (small polygons are assumed)
and the INTERSECTION and NOT constructions are not supported.
The non-standard MOC construction is supported.TFCAT: Time-Frequency region defined by the
TFCat standard.
Support is currently incomplete;
holes in Polygons and MultiPolygons are not displayed correctly,
single Points may not be displayed,
and Coordinate Reference System information is ignored.
areaN value.
colorN = <rrggbb>|red|blue|... (Color)
The standard plotting colour names are
red, blue, green, grey, magenta, cyan, orange, pink, yellow, black, light_grey, white.
However, many other common colour names (too many to list here)
are also understood.
The list currently contains those colour names understood
by most web browsers,
from AliceBlue to YellowGreen,
listed e.g. in the
Extended color keywords section of
the CSS3 standard.
Alternatively, a six-digit hexadecimal number RRGGBB
may be supplied,
optionally prefixed by "#" or "0x",
giving red, green and blue intensities,
e.g. "ff00ff", "#ff00ff"
or "0xff00ff" for magenta.
[Default: red]
crowdlimitN = <n> (Integer)
It is useful for instance if you are looking at pairs of points, which will always be close together; if you set this value to 2, an isolated pair of labels can be seen, but if it's 1 then they will only be plotted when they are distant from each other, which may only happen at very high magnifications.
[Default: 2]
fontsizeN = <int-value> (Integer)
[Default: 12]
fontstyleN = standard|serif|mono (FontType)
The available options are:
standard
serif
mono
[Default: standard]
fontweightN = plain|bold|italic|bold_italic (FontWeight)
The available options are:
plain
bold
italic
bold_italic
[Default: plain]
icmdN = <cmds> (ProcessingStep[])
inN.
The value of this parameter is one or more of the filter
commands described in Section 6.1.
If more than one is given, they must be separated by
semicolon characters (";").
This parameter can be repeated multiple times on the same
command line to build up a list of processing steps.
The sequence of commands given in this way
defines the processing pipeline which is performed on the table.
Commands may alternatively be supplied in an external file,
by using the indirection character '@'.
Thus a value of "@filename"
causes the file filename to be read for a list
of filter commands to execute. The commands in the file
may be separated by newline characters and/or semicolons,
and lines which are blank or which start with a
'#' character are ignored.
A backslash character '\' at the end of a line
joins it with the following line.
ifmtN = <in-format> (String)
inN.
The known formats are listed in Section 5.1.1.
This flag can be used if you know what format your
table is in.
If it has the special value
(auto) (the default),
then an attempt will be
made to detect the format of the table automatically.
This cannot always be done correctly however, in which case
the program will exit with an error explaining which
formats were attempted.
This parameter is ignored for scheme-specified tables.
[Default: (auto)]
inN = <table> (StarTable)
-",
meaning standard input.
In this case the input format must be given explicitly
using the ifmtN
parameter.
Note that not all formats can be streamed in this way.:<scheme-name>:<scheme-args>.<" character at the start,
or a "|" character at the end
("<syscmd" or
"syscmd|").
This executes the given pipeline and reads from its
standard output.
This will probably only work on unix-like systems.istreamN = true|false (Boolean)
inN parameter
will be read as a stream.
It is necessary to give the
ifmtN parameter
in this case.
Depending on the required operations and processing mode,
this may cause the read to fail (sometimes it is necessary
to read the table more than once).
It is not normally necessary to set this flag;
in most cases the data will be streamed automatically
if that is the best thing to do.
However it can sometimes result in less resource usage when
processing large files in certain formats (such as VOTable).
This parameter is ignored for scheme-specified tables.
[Default: false]
labelN = <txt-expr> (String)
The value is a string algebraic expression based on column names as described in Section 10.
spacingN = <pixels> (Integer)
[Default: 12]
texttypeN = plain|antialias|latex (TextSyntax)
Plain and
Antialias
both take the text at face value,
but Antialias
smooths the characters.
LaTeX
interprets the text as LaTeX source code
and typesets it accordingly.
When not using LaTeX, antialiased text usually looks nicer, but can be perceptibly slower to plot. At time of writing, on MacOS antialiased text seems to be required to stop the writing coming out upside-down for non-horizontal text (MacOS java bug).
[Default: plain]
xoffN = <pixels> (Integer)
[Default: 0]
yoffN = <pixels> (Integer)
[Default: 0]