aux
Paints markers in a colour determined by the value of an additional data coordinate, using a colour map shared between all similar layers. The marker colours then represent an additional dimension of the plot. You can also adjust the transparency of the colours used. The way that data values are mapped to colours is usually controlled by options at the level of the plot itself, rather than by per-layer configuration.
Usage:
   shadingN=aux auxN=<num-expr> auxnullcolorN=<rrggbb>|red|blue|...
                opaqueN=<number>
All the parameters listed here
affect only the relevant layer,
identified by the suffix
N.
Example:
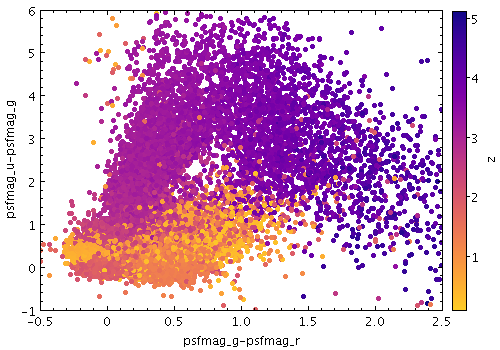
   stilts plot2plane layer1=mark in1=dr5qso.fits
                     x1=psfmag_g-psfmag_r y1=psfmag_u-psfmag_g size1=2
                     shading1=aux aux1=z auxmap=plasma
                     xmin=-0.5 xmax=2.5 ymin=-1 ymax=6
Associated parameters are as follows:
auxN = <num-expr> (String)
This parameter gives a column name, fixed value, or algebraic expression for the
aux coordinate
for layer N.
The value is a numeric algebraic expression based on column names
as described in Section 10.
auxnullcolorN = <rrggbb>|red|blue|... (Color)
The standard plotting colour names are
red, blue, green, grey, magenta, cyan, orange, pink, yellow, black, light_grey, white.
However, many other common colour names (too many to list here)
are also understood.
The list currently contains those colour names understood
by most web browsers,
from AliceBlue to YellowGreen,
listed e.g. in the
Extended color keywords section of
the CSS3 standard.
Alternatively, a six-digit hexadecimal number RRGGBB
may be supplied,
optionally prefixed by "#" or "0x",
giving red, green and blue intensities,
e.g. "ff00ff", "#ff00ff"
or "0xff00ff" for magenta.
If the value is null, then points with a null Aux value will not be plotted at all.
[Default: grey]
opaqueN = <number> (Double)
[Default: 1]