The Quad Position layer control (![]() )
allows you to plot symbols defined by four positions in the plot space
from each row of a table - typically some kind of quadrilateral.
You can add one of these controls to the stack by using the
Add Quad Control (
)
allows you to plot symbols defined by four positions in the plot space
from each row of a table - typically some kind of quadrilateral.
You can add one of these controls to the stack by using the
Add Quad Control (![]() ) button
in the control panel toolbar,
or the corresponding item in the Layers menu.
) button
in the control panel toolbar,
or the corresponding item in the Layers menu.
It works like the Single Position and Pair Position Layer Controls, but the Position tab has fields for four sets of coordinates to fill in.
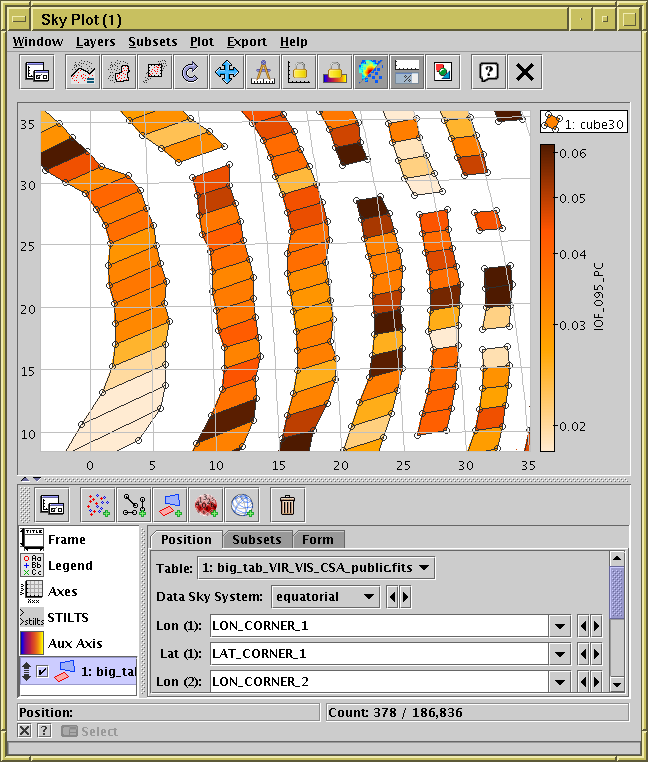
Sky Plot Window with a Quad control
This control is a Table Data control as described in Appendix A.4.2.2. That section explains the Subsets tab; the Position and Form tabs are described in more detail below.
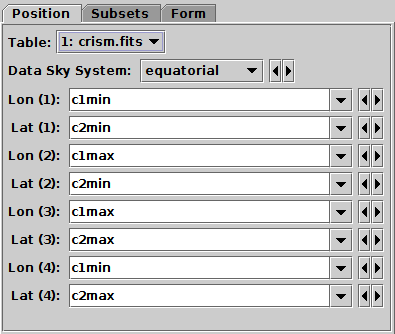
Position tab of Quad Position layer control, for Plane plot
In the Position tab you select a table and enter four sets of position coordinates (using a column name or expression for each one) to define the plotted quadrilaterals.
Note the details of the Position tab will be different for different plot types, for instance the Sky plot has Lon (1), Lat (2) etc for the (longitude,latitude) pairs, while the Cube plot has X (1), Y (1), Z (1) etc. for the 3-dimensional Cartesian triples.
In some cases, for instance EPN-TAP tables with bounding boxes in sky plots, positions will be filled in automatically. You can of course change these default selections.
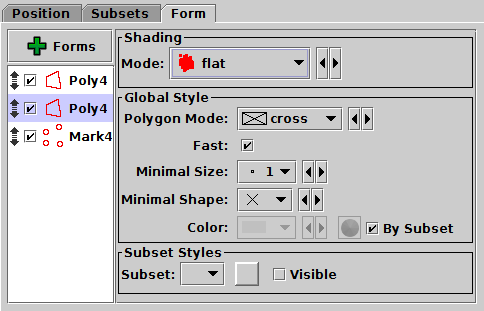
Form tab of Quad Position layer control
The Form tab lets you define how the specified data set is plotted. The list on the left gives a list of forms currently being plotted, and the panel on the right shows the detailed configuration for the currently selected form.
The available forms for a quad plot
(select them using the ![]() Forms button)
are currently
Forms button)
are currently
If you want to draw triangles instead of quadrilaterals, you can just supply the same coordinates for two of the positions. If you want a polygon with more vertices, try the Polygon form from the single position layer control.