Next Previous Up Contents
Next: Colour Maps
Up: Shading Modes
Previous: PAux Mode
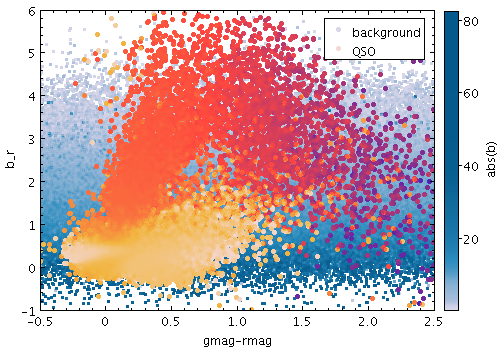
Example PWeighted shading mode plot
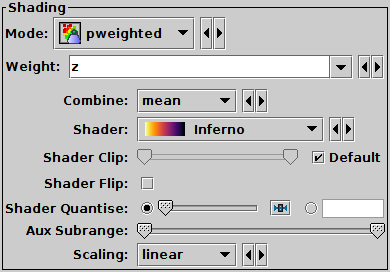
PWeighted mode selection
The PWeighted (private-weighted) shading mode
( )
paints markers using colour indicating weighted density at each pixel,
using a private colour map.
)
paints markers using colour indicating weighted density at each pixel,
using a private colour map.
This mode is like Weighted mode,
except that the colour map is not shared with other layers,
and the colour ramp is not displayed.
So, by using this mode alongside
Aux or Weighted modes
you can make a plot that uses multiple different colour maps,
though only one can have an associated visible ramp.
The options are:
-
Weight
- The weight value applied to each plotted point.
Fill this in with a column name or expression from the table
just like for a positional coordinate.
The exact way this quantity is used depends on the setting of the
Combine control below.
If it's left blank, the weighting is considered to be unity
(all values are 1); this makes sense for some combination types
(e.g. sum) but not others (e.g. mean).
-
Combine
- Determines how the weight values associated with markers
plotted covering a given screen pixel are combined
to produce the numeric value used for that pixel's colour.
The following options (some are more useful than others)
are currently available:
-
sum: the sum of all weights
-
mean: the mean of all weights
-
median: the median of all weights (may be slow)
-
q1: the first quartile of all weights (may be slow)
-
q3: the third quartile of all weights (may be slow)
-
min: the minimum weight
-
max: the maximum weight
-
stdev: the sample standard deviation of all weights
-
count: the number of points plotted
(weight value is ignored, this is like Density mode)
-
hit: one if any point is plotted, blank otherwise
(weight value is ignored, this is like Flat mode)
-
Shader
- The colour map for displaying density values.
There are two types, relative and absolute.
Relative maps have names marked by a star ("*"), and alter the
basic dataset colour, for instance by darkening or lightening it,
while absolute maps (the rest) ignore the basic dataset colour altogether.
For a single-dataset plot, the absolute maps are best, but for
multiple subsets it may be less confusing to use a relative one.
Colour maps are listed in Appendix A.4.7.
-
Shader Clip
- Select a sub-range of the full colour map above.
If the Default checkbox is checked, then all or most
of the colour ramp from the Shader control is used.
If you want to configure the range of colours from the map yourself,
uncheck the Default checkbox, and slide the handles in from the end
of the slider to choose exactly the range you want.
The default range is clipped at one end for colour maps that fade
to white, so that all the plotted colours will be distinguishable
against a white background.
If you don't want that, you can
uncheck Default and leave the handles at the extreme ends of the slider.
-
Shader Flip
- Whether the density scale should map forwards or backwards
into the colour map.
-
Shader Quantise
- Allows the colour map to be quantised.
By default, the colour map is effectively continuous.
If you slide the slider to the right,
or enter a value in the text field,
the map will be split into
a decreasing number of discrete colours. This can be used to generate
a contour-like effect, and may make it easier to trace the boundaries
of regions of interest by eye.
-
Aux Subrange
- Adjusts the density range over which the colour
map is applied. By default the colour map is scaled using limits
found from the aux coordinate in the plot,
but you can restrict the range using this slider.
-
Scaling
- Determines the function used to map the range of aux coordinate values
onto the colour map.
Options are linear,
logarithmic,
histogram,
logarithmic histogram,
asinh,
square,
square root,
arc cosine and
cosine.
Exporting:
When exported to vector formats, the output is automatically forced to a
bitmap for PWeighted-mode layers.
In the case of PostScript, this completely obscures any previous layers.
Next Previous Up Contents
Next: Colour Maps
Up: Shading Modes
Previous: PAux Mode
TOPCAT - Tool for OPerations on Catalogues And Tables
Starlink User Note253
TOPCAT web page:
http://www.starlink.ac.uk/topcat/
Author email:
m.b.taylor@bristol.ac.uk
Mailing list:
topcat-user@jiscmail.ac.uk