Next Previous Up Contents
Next: Fixed Controls
Up: Plot Window Overview
Previous: Distance Measurement
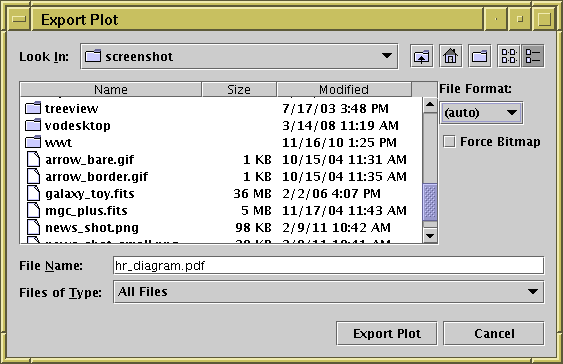
Plot export window
The Plot Export Window can be reached with the
Export plot to file ( )
toolbar button in any of the plot windows.
)
toolbar button in any of the plot windows.
You can select a file in the usual way, and save the plot
in one of the following graphics formats:
-
png
-
PNG bitmap. The background is opaque.
-
png-transp
-
PNG bitmap with a transparent background.
Background pixels that fall outside the plot surface itself
(for instance outside the axes for a Plane plot or outside the
celestial sphere for a Sky plot) are transparent.
-
gif
- GIF bitmap; note the number of colours is limited to 256.
-
jpeg
- JPEG bitmap; note that this is a lossy format, better suited to
photographs than plots, and colours will be blurred.
-
pdf
- Portable Document Format; in most cases this vector format
gives pretty good output, in particular text will be rendered properly.
-
svg
- Scalable Vector Graphics; this XML-based vector format mostly
works quite well, but can result in OutOfMemoryErrors for large
output files.
-
eps
- Encapsulated PostScript; PostScript cannot handle transparency,
which means that in some cases the output will come out wrong.
PostScript files can also be very large if there are many data points.
-
eps-gzip
- Just like eps, but the output is gzipped before output.
There are two additional controls on the right hand side of this window:
-
File Format
- Selects the output file format as above.
The default setting is (auto), which guesses what
format you want to use from the filename, and which usually does the
right thing.
-
Force Bitmap
- This option only has an effect for vector graphics formats
(PDF, SVG and PostScript). If selected, it draws the data contents of the
plot as a pixel map and embeds that into the output file rather than
plotting each point in the output. This may make the output less
beautiful (round markers will no longer be perfectly round),
but it may result in a much smaller file if there are very many
data points. Plot annotations such as axis labels will not be
affected - they are still drawn as vector text.
Note that in some cases (e.g. use of the
auto,
density or
weighted
shading modes) this kind of pixellisation will happen in any case.
Exporting to the pixel-based formats (GIF, JPEG, PNG) is fairly
straightforward: each pixel on the screen appears as one pixel
in the output file. PNG is generally recommended.
GIF works well in most cases, but if there are
more than 255 colours some of the colour resolution will be lost.
JPEG can preserve a wide range of colours, but does not support
transparency and is lossy, so close inspection of image features
will reveal blurring.
When exporting to Portable Document Format (PDF),
Scalable Vector Graphics (SVG) or
Encapsulated PostScript (EPS), which are vector graphics formats,
there are a few things to consider:
-
Positional Quantisation
- Some of the shading modes
(Density,
Weighted,
Auto) are inherently pixellated,
and others
(Flat,
Aux) are not.
In the former case you will see
pixel boundaries for the plotted points rather than nice rounded
edges at high magnifications (though text and axes will always be
plotted nicely).
In both cases, at present the positional
resolution is the same as it would be on the screen, so if you
have a 400-pixel high plot for instance, there are only 400 possible
Y coordinates at which a marker can be plotted, which in general
is not obvious by looking at the output plot.
In future versions the positional resolution of non-pixellated modes
may be improved.
In either case, increasing the size of the plot on the screen
by resizing the window before performing an export to PDF, SVG or EPS
will reduce the effect of the positional quantisation.
Note it will also have the effect of making the text labels
proportionally smaller to the graphics, so you may want to
increase the font size too.
-
Transparency
- For technical reasons transparent markers cannot easily
be rendered when a plot is exported to PostScript. In some cases
the plot is done using a bitmap in the PostScript output to permit
transparency and in some cases the points are just plotted opaque.
PDF does a bit better, but the compositing of transparent shapes is
sometimes a bit different on the screen and rendered to a PDF.
It's a good idea to check the output of screen exports by looking
at the produced file - if it doesn't look like it should do,
setting the Force Bitmap option will probably
make sure it does, though this will also pixellate the plotted symbols.
There is more discussion of this point in the subsections for
the various shading modes.
-
File Size
- In some cases (2D and 3D scatter plots with many thousands of points
or more)
output EPS files can get extremely large; the size scales
with the number of points drawn, currently with a factor of a few
hundred bytes per point. In some cases you can work round this by
plotting some points as transparent so that the plot is rendered
as a bitmap (see the discussion of transparency above) which
scales as the number of pixels rather than the number of points.
The Gzipped EPS format helps somewhat (though can be slow);
PDF output is better still. Even PDF files may be unmanageably large
for very many points however.
Next Previous Up Contents
Next: Fixed Controls
Up: Plot Window Overview
Previous: Distance Measurement
TOPCAT - Tool for OPerations on Catalogues And Tables
Starlink User Note253
TOPCAT web page:
http://www.starlink.ac.uk/topcat/
Author email:
m.b.taylor@bristol.ac.uk
Mailing list:
topcat-user@jiscmail.ac.uk