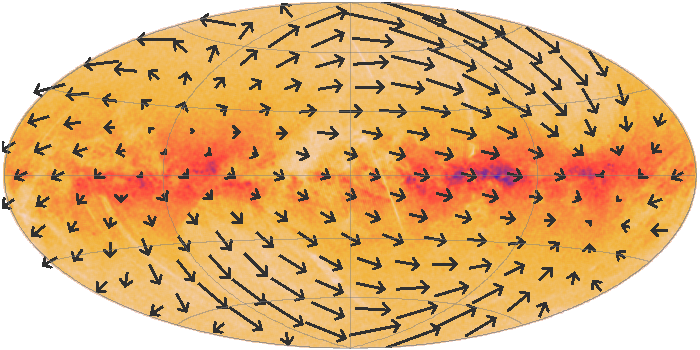
skyvecfield
Plots a field of arrows on a HEALPix grid corresponding to the aggregated (typically averaged) value of a 2-d vector quantity such as proper motion for the points in each cell.
Currently, the visible length of the vectors is dependent
on the size of the grid; they are sized to appear with a
length comparable to the size of the HEALPix cells.
Units of the values specified are therefore not relevant.
This length can be adjusted by use of the
scale option.
By default, the absolute values of the vectors are plotted.
However, if the
relative option
is set, the mean vector value averaged over the visible plot area
will be calculated and subtracted from all the plotted vectors.
The effect of this is to show local variations rather than
absolute values of the vectors over the visible area.
Usage Overview:
   layerN=skyvecfield colorN=<rrggbb>|red|blue|...
                      arrowN=small_arrow|medium_arrow|... thickN=<int-value>
                      scaleN=<number> levelN=<-rel-level|+abs-level>
                      combineN=mean|sum relativeN=true|false lonN=<deg-expr>
                      latN=<deg-expr> vlonN=<num-expr> vlatN=<num-expr>
                      weightN=<num-expr> inN=<table> ifmtN=<in-format>
                      istreamN=true|false icmdN=<cmds>
All the parameters listed here
affect only the relevant layer,
identified by the suffix
N.
Example:
   stilts plot2sky xpix=700 ypix=350 projection=aitoff datasys=equatorial viewsys=galactic labelpos=none
                   in=tgas_source.fits lon=ra lat=dec
                   layer_1=mark shading_1=density densemap_1=sunset densefunc_1=sqrt
                   layer_2=skyvecfield vlon_2=pmra vlat_2=pmdec color_2=#303030 arrow_2=large_arrow thick_2=1
arrowN = small_arrow|medium_arrow|... (MultiPointShape)
The available options are:
small_arrow
medium_arrow
large_arrow
small_open_dart
medium_open_dart
large_open_dart
small_filled_dart
medium_filled_dart
large_filled_dart
lines
capped_lines
[Default: small_arrow]
colorN = <rrggbb>|red|blue|... (Color)
The standard plotting colour names are
red, blue, green, grey, magenta, cyan, orange, pink, yellow, black, light_grey, white.
However, many other common colour names (too many to list here)
are also understood.
The list currently contains those colour names understood
by most web browsers,
from AliceBlue to YellowGreen,
listed e.g. in the
Extended color keywords section of
the CSS3 standard.
Alternatively, a six-digit hexadecimal number RRGGBB
may be supplied,
optionally prefixed by "#" or "0x",
giving red, green and blue intensities,
e.g. "ff00ff", "#ff00ff"
or "0xff00ff" for magenta.
[Default: red]
combineN = mean|sum (Combiner)
The available options are:
mean: the mean of the combined valuessum: the sum of all the combined values per bin[Default: mean]
icmdN = <cmds> (ProcessingStep[])
inN.
The value of this parameter is one or more of the filter
commands described in Section 6.1.
If more than one is given, they must be separated by
semicolon characters (";").
This parameter can be repeated multiple times on the same
command line to build up a list of processing steps.
The sequence of commands given in this way
defines the processing pipeline which is performed on the table.
Commands may alternatively be supplied in an external file,
by using the indirection character '@'.
Thus a value of "@filename"
causes the file filename to be read for a list
of filter commands to execute. The commands in the file
may be separated by newline characters and/or semicolons,
and lines which are blank or which start with a
'#' character are ignored.
A backslash character '\' at the end of a line
joins it with the following line.
ifmtN = <in-format> (String)
inN.
The known formats are listed in Section 5.1.1.
This flag can be used if you know what format your
table is in.
If it has the special value
(auto) (the default),
then an attempt will be
made to detect the format of the table automatically.
This cannot always be done correctly however, in which case
the program will exit with an error explaining which
formats were attempted.
This parameter is ignored for scheme-specified tables.
[Default: (auto)]
inN = <table> (StarTable)
-",
meaning standard input.
In this case the input format must be given explicitly
using the ifmtN
parameter.
Note that not all formats can be streamed in this way.:<scheme-name>:<scheme-args>.<" character at the start,
or a "|" character at the end
("<syscmd" or
"syscmd|").
This executes the given pipeline and reads from its
standard output.
This will probably only work on unix-like systems.istreamN = true|false (Boolean)
inN parameter
will be read as a stream.
It is necessary to give the
ifmtN parameter
in this case.
Depending on the required operations and processing mode,
this may cause the read to fail (sometimes it is necessary
to read the table more than once).
It is not normally necessary to set this flag;
in most cases the data will be streamed automatically
if that is the best thing to do.
However it can sometimes result in less resource usage when
processing large files in certain formats (such as VOTable).
This parameter is ignored for scheme-specified tables.
[Default: false]
latN = <deg-expr> (String)
The value is a numeric algebraic expression based on column names as described in Section 10.
levelN = <-rel-level|+abs-level> (Integer)
If the supplied value is a non-negative integer, it gives the absolute level to use; at level 0 there are 12 pixels on the sky, and the count multiplies by 4 for each increment.
If the value is negative, it represents a relative level; it is approximately the (negative) number of screen pixels along one side of a HEALPix sky pixel. In this case the actual HEALPix level will depend on the current zoom.
[Default: -4]
lonN = <deg-expr> (String)
The value is a numeric algebraic expression based on column names as described in Section 10.
relativeN = true|false (Boolean)
[Default: false]
scaleN = <number> (Double)
[Default: 1]
thickN = <int-value> (Integer)
[Default: 0]
vlatN = <num-expr> (String)
The value is a numeric algebraic expression based on column names as described in Section 10.
vlonN = <num-expr> (String)
The value is a numeric algebraic expression based on column names as described in Section 10.
weightN = <num-expr> (String)
The value is a numeric algebraic expression based on column names as described in Section 10.