Next Previous Up Contents
Next: SkyGrid Layer Control
Up: Layer Controls
Previous: XYArray Layer Control
The Function layer control ( )
is only available for the
Plane,
Histogram and
Time plots.
You can add one of these controls to the stack by using the
Add Function Control (
)
is only available for the
Plane,
Histogram and
Time plots.
You can add one of these controls to the stack by using the
Add Function Control ( ) button
in the control panel toolbar,
or the corresponding item in the Layers menu.
) button
in the control panel toolbar,
or the corresponding item in the Layers menu.
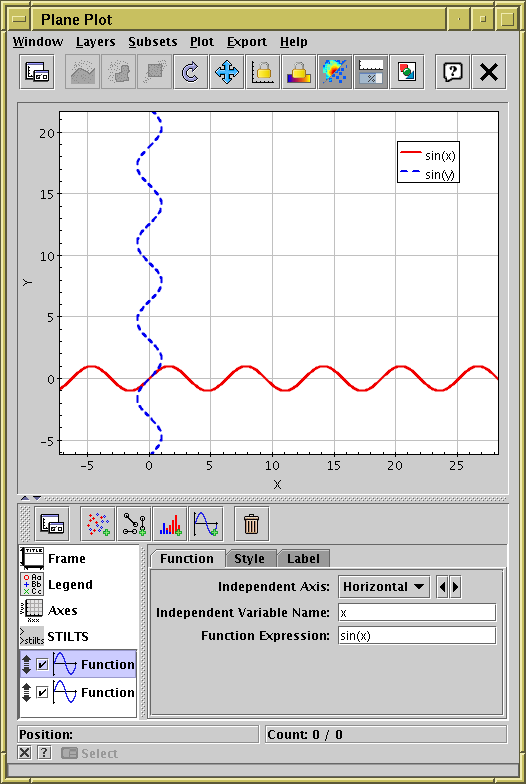
Plane plot with two function layers plotted,
one as a function of Horizontal axis value, and
one as a function of Vertical axis value
This control has three tabs,
Function, Style and Label,
described below.
Function Tab
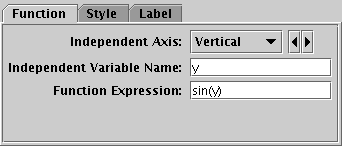
Function control Function tab
The Function tab defines the function to be plotted
and has the following fields:
-
Independent Axis
- Which axis the independent variable varies along;
options are currently
Horizontal and Vertical.
-
Independent Variable Name
- Name of the independent variable.
This is typically
x for a horizontal independent variable
and y for a vertical independent variable,
but any string that is a legal expression language identifier
(starts with a letter, continues with letters, numbers, underscores)
can be used.
-
Function Expression
- An expression using TOPCAT's expression language
in terms of the independent variable that defines the function.
This expression must be standalone, it cannot reference any tables.
It can however reference Global Variables.
Style Tab
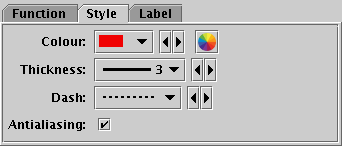
Function control Style tab
The Style tab configures the plotting style.
Options are:
-
Colour
- Colour of the line.
-
Thickness
- Thickness of the line in pixels.
-
Dash
- Dash pattern of the line - solid is the default, but various
options are available.
-
Antialiasing
- If true, lines are antialiased, which makes them look smoother
on the screen or bitmapped export images.
Has no effect on vector export images (PDF, SVG, EPS).
Label Tab
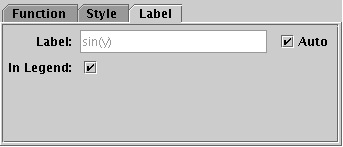
Function control Label tab
The Label tab allows you to choose the text
that appears in the legend. Options are:
-
Label
- Gives the label that will appear in the legend.
By default the function expression is used, but if you want to
override this you can deselect the associated Auto
checkbox and enter your own value.
-
In Legend
- If true, an entry for this function appears in the legend,
if false it does not.
Note the setting of this value does not affect whether the legend
itself appears, which is controlled by the
Legend control.
Next Previous Up Contents
Next: SkyGrid Layer Control
Up: Layer Controls
Previous: XYArray Layer Control
TOPCAT - Tool for OPerations on Catalogues And Tables
Starlink User Note253
TOPCAT web page:
http://www.starlink.ac.uk/topcat/
Author email:
m.b.taylor@bristol.ac.uk
Mailing list:
topcat-user@jiscmail.ac.uk