The Axes control (![]() ) for the
corner plot window has the following tabs:
) for the
corner plot window has the following tabs:
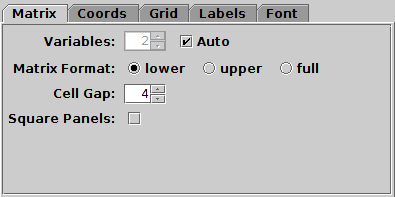
Matrix tab of corner Axes control
The Matrix tab configures the grid on which the individual plots are placed. It has the following options:
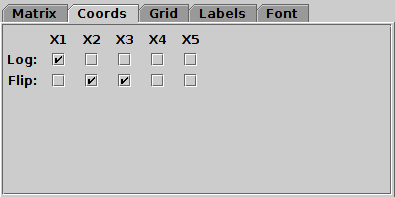
Coords tab of corner Axes control
The Coords tab controls the axis coordinates. For each currently visible axis there are two checkboxes:
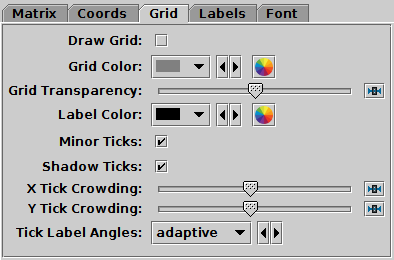
Grid tab of corner Axes control
The Grid tab configures the appearance of the axis grid in each panel. It has the following options:
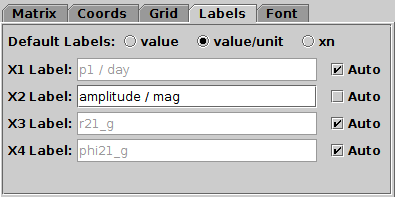
Labels tab of corner Axes control
The Labels tab controls the text labels on the axes. The axes are labelled according to the text listed for each coordinate X1, X2, .... By default these labels are assigned automatically, but you can override this by unchecking the Auto checkbox for the coordinate in question to enter your own text.
The automatically assigned values are generally taken by looking at the values entered into the coordinate selector fields of the Position tabs controlling the plot, but the details are determined by the Default Labels selector. This has three options:
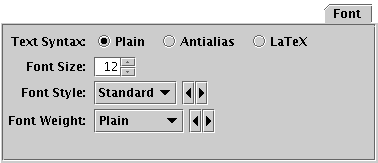
Font tab
The Font tab configures the font used for axis annotation. It also affects some other things like the legend.