Next Previous Up Contents
Next: XYArray Layer Control
Up: Layer Controls
Previous: Area Layer Control
The Spectrogram Layer Control ( )
plots a spectrum at successive (usually, but not necessarily,
regularly-spaced) points in a time series.
It is only available for the
Time Plot Window;
you can add one of these controls to the stack by using the
Add Spectrogram Control (
)
plots a spectrum at successive (usually, but not necessarily,
regularly-spaced) points in a time series.
It is only available for the
Time Plot Window;
you can add one of these controls to the stack by using the
Add Spectrogram Control ( ) button
in the control panel toolbar,
or the corresponding item in the Layers menu.
) button
in the control panel toolbar,
or the corresponding item in the Layers menu.
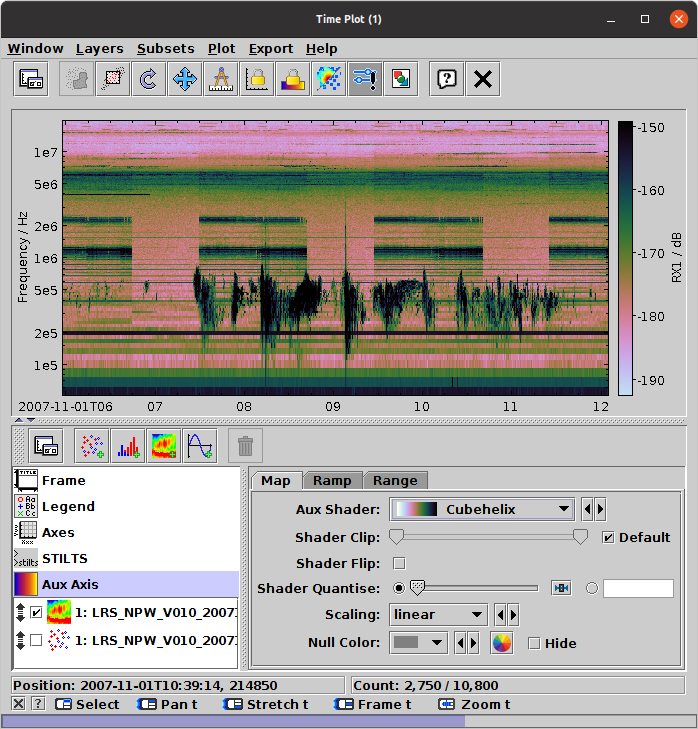
Time Plot window with a Spectrogram layer
This control has layer-specific tabs
Data and Style,
described below.
The Zone tab is described in Appendix A.4.14.1.
To control the colour map used to represent the spectral values,
use the Aux  fixed control.
Data Tab
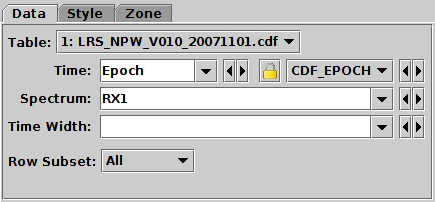
Spectrogram control Data tab
The Data tab allows you to specify which values from
a table will generate a spectrogram.
It has the following fields:
-
Table
- The table supplying the data.
-
Time
- A table column or expression giving the epoch coordinate at which
spectra are located.
This should normally be a time-typed column;
if it is simply of numeric type it will be interpreted as seconds
since 1 Jan 1970.
-
Spectrum
- An array-valued table column giving the spectral data.
-
TimeWidth
- A table column or expression (variable or constant) giving the
temporal coverage of a plotted spectrum.
If not filled in, it is assumed to be the most common
(median) difference between time points.
-
Row Subset
- The subset for which the spectrum should
be plotted. To plot multiple subsets (not usually useful with this
kind of plot) you would need multiple spectrogram layer controls
in the stack.
Style Tab
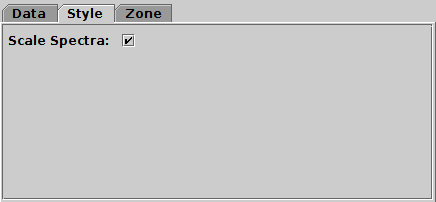
Spectrogram control Style tab
The Style tab configures the plotting style.
Options are:
-
Scale Spectra
- If this option is checked (the default), an attempt will be made
to plot the spectra on a vertical axis that represents
their physical values.
This is only possible if the column or table metadata contains a
suitable array that gives bin extents or central wavelengths or similar.
An ad hoc search is made of column and table metadata
to find an array that looks like it is intended for this purpose.
If this option is unchecked, or if no suitable array can be found,
the vertical axis just represents channel indices
and so is labelled from 0 to the number of channels per spectrum.
This configuration item is somewhat experimental;
the details of how the spectral axis is configured may change
in future releases.
Next Previous Up Contents
Next: XYArray Layer Control
Up: Layer Controls
Previous: Area Layer Control
TOPCAT - Tool for OPerations on Catalogues And Tables
Starlink User Note253
TOPCAT web page:
http://www.starlink.ac.uk/topcat/
Author email:
m.b.taylor@bristol.ac.uk
Mailing list:
topcat-user@jiscmail.ac.uk