Next Previous Up Contents
Next: DataLink Window
Up: Table View Windows
Previous: Subsets Window
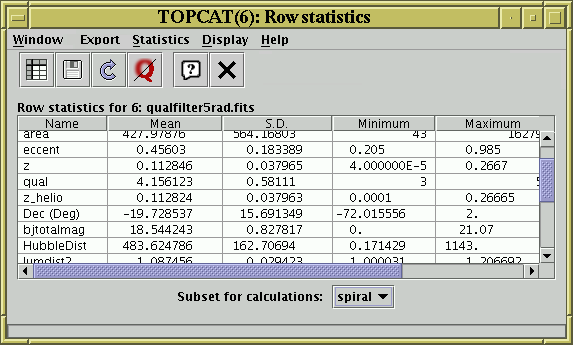
Statistics Window
The Statistics Window shows statistics for the values in each
of the table's columns.
You can display it using the Column Statistics ( )
button when the chosen table is selected in the
Control Window's Table List.
)
button when the chosen table is selected in the
Control Window's Table List.
The calculated values are displayed in a
JTable widget with a row for each
column in the main table, and a column for each of a number of
statistical quantities calculated on some or all of
the values in the data table column corresponding to that grid row.
You can interact with this JTable in the usual ways,
for instance dragging columns sideways, changing their widths,
and sorting the entries by clicking on the headings.
The following columns are shown by default:
-
Name
- The name of the column in the main table represented by this grid row.
-
Mean
- The mean value of the good cells. For boolean columns, this is
the proportion of good cells which are True.
-
SD
- The population standard deviation of the good cells.
-
Minimum
- The minimum value. For numeric columns the meaning of this is quite
obvious. For other columns, if an ordering can be reasonably defined
on them, the 'smallest' value may be shown. For instance string
values will show the entry which would be first alphabetically.
-
Maximum
- As minimum, but shows the largest values.
-
nGood
- The number of non-blank cells.
Several additional items of statistical information are also calculated,
but the columns displaying these are hidden by default to avoid clutter.
You can reveal these by using the Display menu:
-
Index
- The index of the column in the table, i.e. the order in which
it is displayed.
-
$ID
- The unique identifier label for the column in the main table.
-
Sum
- The sum of all the values in the column. For boolean columns this
is a count of the number of True values in the column.
-
Variance
- The population variance of the good cells.
-
Sample SD
- The sample standard deviation of the good cells.
-
Sample Variance
- The sample variance of the good cells.
-
Median Absolute Deviation
- The median of absolute deviations from the median:
median(abs(x-median(x)).
This is a robust measure of statistical dispersion.
-
Scaled Median Absolute Deviation
- The Median Absolute Deviation (see above) multiplied
by 1.4826.
This is supposed to be a consistent estimator for the standard deviation,
on the assumption of a normal distribution.
-
Skew
- Gamma 1 measure of skewness of the value distribution.
-
Kurtosis
- Gamma 2 measure of peakedness of the value distribution.
-
Row of min
- The index of the row in the main table at which the minimum value
occurred.
-
Row of max
- The index of the row in the main table at which the maximum value
occurred.
-
nBad
- The number of blank cells; the sum of
this value and the Good cells value will be the same for each
column.
-
Cardinality
- If the column contains a small number of distinct values
then that number, the column's cardinality will be shown here.
Cardinality is the number of distinct values which appear in that column.
If the number of values represented is large (currently >50) or
a large proportion of the non-bad values (currently >75%) then
no value is shown.
Some of these quantities are suitable only for array-valued columns,
and calculate per-element array statistics that are arrays of the same
length as the input values (the input arrays must all be the same length):
-
Array nGoods
- Per-element count of the number of non-blank values in the
input arrays.
-
Array Sums
- Per-element sum of the values in the input arrays.
-
Array Means
- Per-element mean of the values in the input arrays.
-
Array SDs
- Per-element population standard deviation of the values
in the input arrays.
In addition, some quantile values can calculated on demand
(by selecting their values in the Display menu, as for
the previous list). The available values are:
-
Q001:
- value below which 0.1% of rows fall
-
Q01:
- value below which 1% of rows fall (1st percentile)
-
Quartile1:
- value below which 25% of rows fall (first quartile)
-
Median:
- value below which 50% of rows fall (median)
-
Quartile3:
- value below which 75% of rows fall (third quartile)
-
Q99:
- value below which 99% of rows fall (99th percentile)
-
Q999:
- value below which 99.9% of rows fall
These are considerably more expensive to calculate than the other
statistical quantities, and so they are not provided by default
(the same applies to the MAD).
If you attempt to calculate them for large tables,
you may get a message saying that there is insufficient memory.
In this case you can use an approximate quantile calculation
method which is not memory limited: see the description below of the
Approximate Quantile Calculation ( ) option.
The quantities displayed in this window are not necessarily those for
the entire table; they are those for a particular
Row Subset.
At the bottom of the window is the Subset For Calculations
selector, which allows you
to choose which subset you want the calculations to be done for.
By clicking on this you can calculate the statistics for different
subsets.
When the window is first opened, or when it is invoked from a menu
or the toolbar in the Control Window,
the subset will correspond to the current row subset.
The toolbar contains the following extra buttons:
-
 Save as Table
- Clicking this button will save the quantities displayed in this
window to a table on disk. It can be saved in any of the tabular
formats which TOPCAT understands.
-
 Import as Table
- The table of statistical quantities displayed by this window
(rows corresponding to input table columns and columns corresponding
to statistical quantities) is itself a table. By clicking this
button it can be loaded into TOPCAT as a new table and manipulated
in all the usual ways. This has the same effect as saving the
statistics to file (see previous button) and then reloading that file.
-
 Recalculate
- Once statistics have been calculated for a given subset they are
cached and not normally recalculated again.
Use this button if you want to force a recalculation because the
data may have changed.
-
Approximate Quantile Calculation
- If selected this button will cause the quantiles to be calculated
using a method which is both approximate and slower than the
default (exact) method, for which reason it's usually not preferred.
However, the approximate method executes in constant memory,
while the exact method can fail by running out of memory
for very large row counts.
For a large table the calculations may take a little while. While they are
being performed you can interact with the window as normal,
but a progress bar is shown at the bottom of the window.
If you initiate a new calculation (by pushing the Recalculate button or
selecting a new subset) or close the window during a calculation,
the superceded calculation will be stopped.
Next Previous Up Contents
Next: DataLink Window
Up: Table View Windows
Previous: Subsets Window
TOPCAT - Tool for OPerations on Catalogues And Tables
Starlink User Note253
TOPCAT web page:
http://www.starlink.ac.uk/topcat/
Author email:
m.b.taylor@bristol.ac.uk
Mailing list:
topcat-user@jiscmail.ac.uk