Next Previous Up Contents
Next: Quantile Form
Up: Plot Forms
Previous: Line3d Form
The Linear Fit form ( )
determines a least-squares best fit of a line to the data points,
optionally weighted by a given value, and plots the corresponding line.
)
determines a least-squares best fit of a line to the data points,
optionally weighted by a given value, and plots the corresponding line.
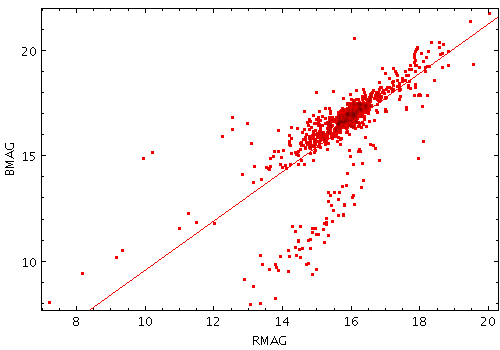
Example LinearFit plot
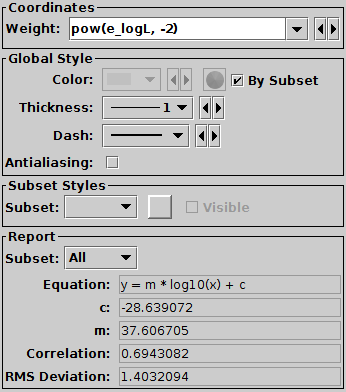
Linear Fit configuration panel
The configuration options are:
-
Weight
- Weighting to apply to each point.
If left blank, no weighting (equivalent to unit weighting) is applied.
If independent sampling errors
E are available for each point,
a suitable value for this may be 1./(E*E)
(equivalently pow(E,-2)).
-
Thickness
- Line thickness in pixels.
-
Dash
- Dash pattern. The line is solid by default.
-
Antialiasing
- If true, pixels are blurred to give the line a smoother appearance.
As well as drawing the line onto the plot,
the calculated fitting coefficients are
displayed at the bottom of the form configuration panel,
under the heading Report.
Note the coefficients are calculated by subset, and
are only displayed for one subset at a time.
To see the calculated values, select the subset of interest in
the Subset selector.
The reported items are:
-
Equation
- The equation of the line.
The basic linear equation is
y=m*x+c,
but if one or both of the axes are plotted logarithmically,
the fit is performed to take account of this, and the equation
is displayed accordingly.
-
c
- The constant intercept of the line on the Y axis.
-
m
- The line gradient.
-
Correlation
- Pearson's product moment correlation coefficient.
-
RMS Deviation
- The root-mean-squared deviation of the data from the fitted line, i.e.
for the case where both axes are linear,
Sqrt( Sum[ wi
(yi - m.xi - c)2 ]
/ N )
Next Previous Up Contents
Next: Quantile Form
Up: Plot Forms
Previous: Line3d Form
TOPCAT - Tool for OPerations on Catalogues And Tables
Starlink User Note253
TOPCAT web page:
http://www.starlink.ac.uk/topcat/
Author email:
m.b.taylor@bristol.ac.uk
Mailing list:
topcat-user@jiscmail.ac.uk