Next Previous Up Contents
Next: Polygon Form
Up: Plot Forms
Previous: XYCorr Form
The SkyCorr ( ) form
plots an error ellipse (or rectangle or other similar figure)
on the sky defined by errors in the longitude and latitude directions,
and a correlation between the two errors.
) form
plots an error ellipse (or rectangle or other similar figure)
on the sky defined by errors in the longitude and latitude directions,
and a correlation between the two errors.
The error in longitude is considered to be premultiplied
by the cosine of the latitude,
i.e. both errors correspond to angular distances along a great circle.
The supplied correlation is a dimensionless value in the range -1..+1
and is equal to the covariance divided by the product
of the lon and lat errors.
The covariance matrix is thus:
   [  lonerr*lonerr       lonerr*laterr*corr  ]
   [  lonerr*laterr*corr  laterr*laterr       ]
This plot type is suitable for use with the
ra_error, dec_error and ra_dec_corr
columns in the Gaia source catalogue.
Note however that Gaia positional errors are generally quoted
in milli-arseconds (mas),
while this plotter requires lon/lat errors in degrees,
so to plot true error ellipses
it is necessary to divide the Gaia error values by 3.6e6.
In most plots, Gaia position errors are much too tiny to see!
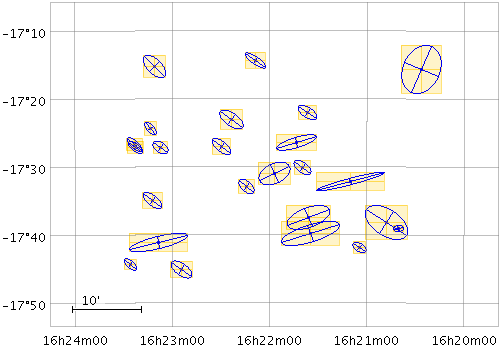
Example SkyCorr plot
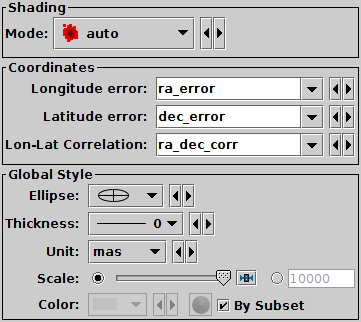
SkyCorr form configuration panel
The configuration options are:
-
Shading mode
- See Appendix A.4.6.
-
Longitude error
- Error in longitude in degrees, multiplied by the cosine of the latitude.
-
Latitude error
- Error in latitude in degrees.
-
Lon-Lat correlation
- Correlation between the errors in longitude and latitude.
This is a dimensionless quantity in the range -1..+1,
and is equivalent to the covariance divided by the product
of the Longitude and Latitude error values themselves.
It corresponds to the
ra_dec_corr value
supplied in the Gaia source catalogue.
-
Ellipse
- Ellipse graphical representation, selected from a range of options
(includes also rectangles, crosses etc).
-
Thickness
- Controls the line thickness used when drawing ellipses.
Zero, the default value, means a 1-pixel-wide line is used.
Larger values make drawn lines thicker, but note changing
this value will not affect all shapes, for instance filled
polygons contain no line drawings.
-
Unit
- Gives the units in which the Longitude and Latitude errors
are supplied. Options are degrees, arcseconds etc.
If the special value scaled
is given then a non-physical scaling
is applied to the input values to make the the largest markers
appear at a reasonable size (a few tens of pixels) in the plot.
Note that the actual plotted size of the markers can also be scaled
using the scale option;
these two work together to determine the actual plotted sizes.
-
Scale
- Scales the size of plotted ellipses.
The default value is 1, smaller or larger values multiply the
visible sizes accordingly.
The main purpose of this option is to tweak the visible sizes of
the plotted markers for better visibility. The unit
option is more convenient to account for the units in which
the angular extent coordinates are supplied.
If the markers are supposed to be plotted with their absolute
angular extents visible, this option should be set to its
default value of 1.
Next Previous Up Contents
Next: Polygon Form
Up: Plot Forms
Previous: XYCorr Form
TOPCAT - Tool for OPerations on Catalogues And Tables
Starlink User Note253
TOPCAT web page:
http://www.starlink.ac.uk/topcat/
Author email:
m.b.taylor@bristol.ac.uk
Mailing list:
topcat-user@jiscmail.ac.uk