Next Previous Up Contents
Next: SkyVecField Form
Up: Plot Forms
Previous: Grid Form
The SkyDensity form ( )
plots a density map on the sky using a HEALPix grid
with a configurable resolution.
You can optionally use a weighting for the data values to accumulate
within each HEALPix tile,
and you can configure how the weighted values are combined to
generate the eventual pixel values (and hence colours).
HEALPix
is a tiling scheme for the sky which uses square-ish pixels
of equal area to cover the celestial sphere.
)
plots a density map on the sky using a HEALPix grid
with a configurable resolution.
You can optionally use a weighting for the data values to accumulate
within each HEALPix tile,
and you can configure how the weighted values are combined to
generate the eventual pixel values (and hence colours).
HEALPix
is a tiling scheme for the sky which uses square-ish pixels
of equal area to cover the celestial sphere.
The shading is done using the shared colour map.
This colour map is used by all currently visible
SkyDensity,
Grid,
Aux and
Weighted layers.
When at least one such layer is being plotted,
the Aux Axis control
is visible
in the control panel, which allows you to configure the colour map,
range, ramp display etc.
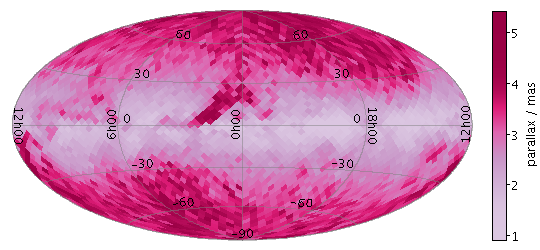
Example SkyDensity plot
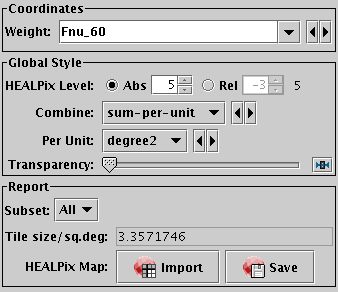
SkyDensity form configuration panel
The configuration options are:
-
Weight
- The weight value applied to each plotted point.
Fill this in with a column name or expression from the table
just like for a positional coordinate.
The exact way this quantity is used depends on the setting of the
Combine control below.
If it's left blank, the weighting is considered to be unity
(all values are 1); this makes sense for some combination types
(e.g. sum) but not others (e.g. mean).
-
HEALPix Level
- This allows you to control the resolution of the HEALPix grid
onto which the weighted values are resampled.
According to the radio buttons, you can configure this using either
a Absolute or Relative value.
In Absolute mode you specify the HEALPix level (k) directly;
the number of pixels on the sky is 12*22k.
In Relative mode the level is set so that a HEALPix tile has
approximately the given number of screen pixels along a side,
and hence the absolute level will change if you zoom in and out.
In either case, you can see the absolute level at the right hand side
of the control.
-
Combine
- Determines how the weight values associated with markers
plotted covering a given HEALPix tile are combined
to produce the numeric value used for that tile's colour.
For density-like values
(count-per-unit, sum-per-unit)
the scaling is additionally influenced by the
Per Unit option.
The following options (some are more useful than others)
are currently available:
-
sum:
the sum of all the combined values per bin
-
sum-per-unit:
the sum of all the combined values per unit of bin size
-
count:
the number of non-blank values per bin (weight is ignored)
-
count-per-unit:
the number of non-blank values per unit of bin size
(weight is ignored)
-
mean:
the mean of the combined values
-
median:
the median of the combined values (may be slow)
-
q1:
the first quartile of the combined values (may be slow)
-
q3:
the third quartile of the combined values (may be slow)
-
min: the minimum of all the combined values
-
max: the maximum of all the combined values
-
stdev:
the sample standard deviation of the combined values
-
hit:
1 if any values present, NaN otherwise (weight is ignored)
-
Per Unit
- Defines the unit of sky area used for scaling density-like
Combine values
(e.g.
count-per-unit or sum-per-unit).
If the Combination mode is calculating values per unit area,
this configures the area scale in question.
For non-density-like combination modes
(e.g. sum or mean)
it has no effect.
The available options are:
-
steradian: steradian
-
degree2: square degree
-
arcmin2: square arcminute
-
arcsec2: square arcsecond
-
mas2: square milliarcsec
-
uas2: square microarcsec
-
Opaque Limit
- Determines transparency of the points.
By default, they are fully opaque, but if you slide the slider to
the right, they will become progressively more transparent.
The Report panel provides information calculated
by the plot:
-
HEALPix Level
- Reports the actual HEALPix level of the plotted tiles.
This is not necessarily the value selected in the style configuration
controls, since if tiles would be smaller than screen pixels,
the gridding is automatically degraded.
This value is also reported to the right of the HEALPix Level
configuration control.
-
Tile size/sq.deg
- Reports the size of each plotted tile in square degrees.
This is simply a function of the actual HEALPix level.
-
HEALPix Map
- This allows you to export the healpix map that you can see in the plot
in the form of a table.
The current implementation writes the table for the whole sky,
not just the cells that are visible in the current plot.
The table has a row for each healpix pixel;
depending on how sparse the data is the HEALPix index might be implicit
(corresponding to row index) or explicitly given as a column value.
There is also a column giving the pixel value
(corresponding to the colour in the plot).
The Import (
 ) option
loads the data as a new table in the TOPCAT application, and
the Save (
) option
loads the data as a new table in the TOPCAT application, and
the Save ( ) option
lets you save it directly to disk in one of the available table formats.
This information is also available from the Export menu.
) option
lets you save it directly to disk in one of the available table formats.
This information is also available from the Export menu.
Some notes apply for this export:
- If you want to export the table following the
HEALPix-FITS convention
in a form suitable for use in other applications such as Aladin,
you should save it using the output format fits-healpix
rather than one of the other FITS variants.
- When exported as FITS, the sky coordinate system
(FITS
COORDSYS header) is determined by the current
value of the View Sky System, as reported in the
Sky Axes Control.
- The HEALPix level at which the data is exported is that currently
plotted as reported by the HEALPix Level report item
above, not necessarily the one selected in the style configuration
controls.
Next Previous Up Contents
Next: SkyVecField Form
Up: Plot Forms
Previous: Grid Form
TOPCAT - Tool for OPerations on Catalogues And Tables
Starlink User Note253
TOPCAT web page:
http://www.starlink.ac.uk/topcat/
Author email:
m.b.taylor@bristol.ac.uk
Mailing list:
topcat-user@jiscmail.ac.uk