The StatLine form (![]() ),
available from the
XYArray Layer Control,
plots a single line based on a combination (typically the mean) of
input array-valued coordinates. The input X and Y coordinates must be
fixed-length arrays of length N; a line with N points is plotted, each
point representing the mean (or median, minimum, maximum, ...) of all
the input array elements at the corresponding position.
),
available from the
XYArray Layer Control,
plots a single line based on a combination (typically the mean) of
input array-valued coordinates. The input X and Y coordinates must be
fixed-length arrays of length N; a line with N points is plotted, each
point representing the mean (or median, minimum, maximum, ...) of all
the input array elements at the corresponding position.
Note that because the X and Y arrays must be of a fixed size for all rows, and because combination is performed in both X and Y directions, this is typically only suitable for plotting combined spectra if they all share a common horizontal axis, e.g. are all sampled into the same wavelength bins. To visually combine spectra with non-uniform sampling, the ArrayQuantile form may be more useful.
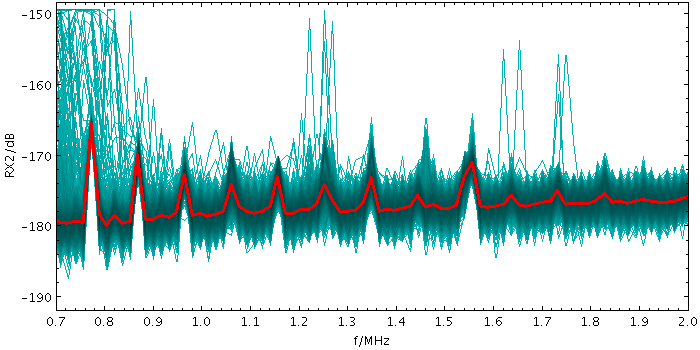
Example StatLine plot
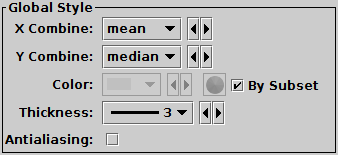
StatLine form configuration panel
The configuration options are:
mean:
the mean of the combined valuesmedian:
the median of the combined values (may be slow)min: the minimum of all the combined valuesmax: the maximum of all the combined valuesq.01:
the 1st percentile of the combined values (may be slow)q1:
the first quartile of the combined values (may be slow)q3:
the third quartile of the combined values (may be slow)q.99:
the 99th percentile of the combined values (may be slow)stdev:
the sample standard deviation of the combined valuessum: the sum of all the combined valuescount: the number of non-blank values