Next Previous Up Contents
Next: Histogram Form
Up: Plot Forms
Previous: Fill Form
The VecField form ( )
plots a field of arrows on a regular grid corresponding to the
aggregated (typically averaged) value of a 2-d vector quantity for the
points in each grid cell.
)
plots a field of arrows on a regular grid corresponding to the
aggregated (typically averaged) value of a 2-d vector quantity for the
points in each grid cell.
Currently, the X and Y components of the vectors are normalised separately
and scaled so that the arrows are shown with components
comparable to the dimensions of the grid cells.
This length can be adjusted by use of the Scale control.
By default, the absolute values of the vectors are plotted.
However, if the Relative option is set,
the mean vector value averaged over the visible plot area
will be calculated and subtracted from all the plotted vectors.
The effect of this is to show local variations rather than absolute
values of the vectors over the visible area.
The value of such mean offsets is displayed in the
Report panel at the bottom of the layer control panel.
The X and Y dimensions of the grid cells (or equivalently histogram bins)
can be configured either in terms of the data coordinates or relative
to the plot dimensions.
This form may be used in the Plane
plot window.
The SkyVecField form does the same thing
for a Sky plot.
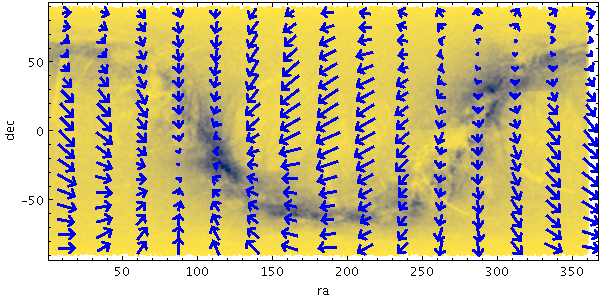
Example VecField plot
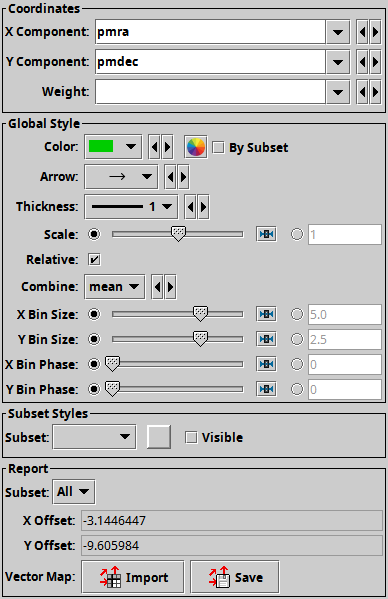
VecField form configuration panel
The configuration options are:
-
X Component
-
Y Component
- Components of the 2-d vector values to combine per cell and plot.
Since these values are normalised before plotting,
units are not significant.
-
Weight
- An optional weighting to apply to each vector.
-
Color
- Colour of the arrows.
-
Arrow
- Arrow shape selected from a range of options.
-
Thickness
- Controls the line thickness used when drawing arrows.
Zero, the default value, means a 1-pixel-wide line is used,
and larger values make drawn lines thicker.
-
Scale
- Changes the factor by which all vector lengths are scaled.
If the arrows are too small, slide it right, if they are too big,
slide it left. The slider scale is logarithmic.
Alternatively, enter a fixed value in the text field.
The default value of unity corresponds to vectors that are
a sensible size for the cell grid.
-
Relative
- If true, the mean value for all the vectors in the field of view
is calculated and subtracted from each displayed vector.
The effect of this is to show local variations rather than absolute
values of the vectors over the visible area.
The value of such mean offsets is displayed in the
Report panel below the configuration controls.
-
Combine
- How the vectors in each cell are combined to determine the
plotted vector in that cell.
By default this is Mean, but Sum
is also an option.
-
X Bin Size
-
Y Bin Size
- A scale for the horizontal/vertical extent of of the rectangular
bins into which the data is aggregated.
There are two ways to specify this.
If the left-hand radio button is selected, the adjacent slider will
adjust the bin size, which is also affected by the actual width of
the plotting window in pixels. Slide the slider left to get narrower
bins or right to get wider ones.
If the right-hand radio button is selected, you can enter a numeric
value giving the actual extent in data units of the dimension.
If the axis in question is logarithmic, this value is a factor.
-
X Bin Phase
-
Y Bin Phase
- Controls where the horizontal/vertical zero point for bins is set.
For instance if your X/Y bin size is 1, it controls whether bin boundaries
on the X/Y axis are at 0, 1, 2, ... or 0.5, 1.5, 2.5, ... etc.
If the slider is at either end of the scale, there will be a bin
boundary at X/Y=0 (linear axis) or X/Y=1 (logarithmic axis).
The Report gives you access to the calculations
made during plotting:
-
X Offset
-
Y Offset
- If the Relative option is selected,
these quantities report the field of view averaged values
that have been subtracted from per-cell values before plotting.
-
Vector Map
- This allows you to export the per-cell combined vector values
that you can see in the plot, in the form of a table.
The table has one row for each plotted vector,
with columns giving the central, lower and upper bounds for each
the X and Y grid coordinates, as well as a columns giving the
aggregated vector X and Y components.
The Import (
 ) option
loads the data as a new table in the TOPCAT application, and
the Save (
) option
loads the data as a new table in the TOPCAT application, and
the Save ( ) option
lets you save it directly to disk in one of the available table formats.
These options are also available from the Export menu.
) option
lets you save it directly to disk in one of the available table formats.
These options are also available from the Export menu.
Next Previous Up Contents
Next: Histogram Form
Up: Plot Forms
Previous: Fill Form
TOPCAT - Tool for OPerations on Catalogues And Tables
Starlink User Note253
TOPCAT web page:
http://www.starlink.ac.uk/topcat/
Author email:
m.b.taylor@bristol.ac.uk
Mailing list:
topcat-user@jiscmail.ac.uk