Next Previous Up Contents
Next: XYErrors Form
Up: Plot Forms
Previous: Handles Form
The YErrors form ( ),
available from the
XYArray Layer Control,
draws a set of symmetric or asymmetric vertical error bars
representing all the elements of X, Y
array-valued coordinates, resulting in a sequence of error bars
for each table row.
),
available from the
XYArray Layer Control,
draws a set of symmetric or asymmetric vertical error bars
representing all the elements of X, Y
array-valued coordinates, resulting in a sequence of error bars
for each table row.
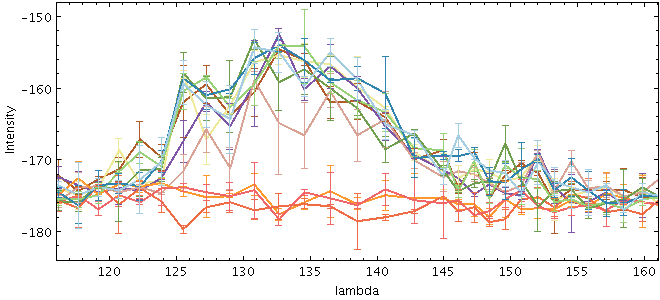
Example YErrors plot
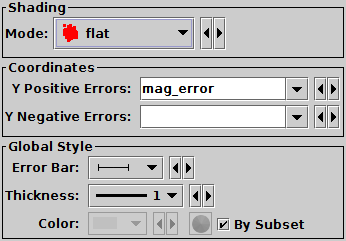
YErrors form configuration panel
The configuration options are:
-
Shading Mode
- See Appendix A.4.6.
-
Y Positive Errors
-
Y Negative Errors
- Array values giving vertical error extents corresponding to the plotted
data position arrays.
If both positive and negative values are filled in,
the errors will be asymmetric.
If the negative value is blank (either because the coordinate is not
filled in, or because its value is NaN for that row),
the error bars will be symmetric,
i.e. the negative error bar will be the same size as the positive one.
If you want to ensure only a positive error bar is plotted,
supply zero for the corresponding negative errors.
The error extents must be positive; negative array elements are ignored.
The column names or expressions used here must be array values,
matching the length of the data array values.
If you need to create or manipulate array values,
the functions in the Arrays class
may be of use here.
-
Error Bar
- Error bar shape from a list of options.
-
Thickness
- Controls the line thickness used when drawing error bars.
Next Previous Up Contents
Next: XYErrors Form
Up: Plot Forms
Previous: Handles Form
TOPCAT - Tool for OPerations on Catalogues And Tables
Starlink User Note253
TOPCAT web page:
http://www.starlink.ac.uk/topcat/
Author email:
m.b.taylor@bristol.ac.uk
Mailing list:
topcat-user@jiscmail.ac.uk