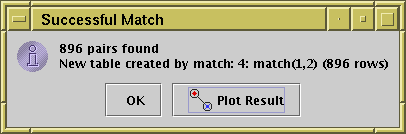
Pair plot completion confirmation dialogue
Having performed a crossmatch, it is very often a good idea to look at the results graphically. If you can plot the input catalogues, and the output catalogue, with an indication of which rows in the inputs have been joined together, you can rapidly get a good idea of the result of the match, and whether it did what you expected. This is especially true in the presence of crowded fields, tentative match criteria, or other circumstances under which the match might not go as expected.
Since TOPCAT version 4.1, for most pair matches, you can do this automatically. When a suitable match completes, you may see a confirmation dialogue like this:
Pair plot completion confirmation dialogue
If you click the OK button, it will simply dismiss the dialogue. However, if you click the Plot Result button, a new plot window will appear with all the points from the input catalogues and pair links (lines between the joined positions) for the joined rows. The result is something like this:
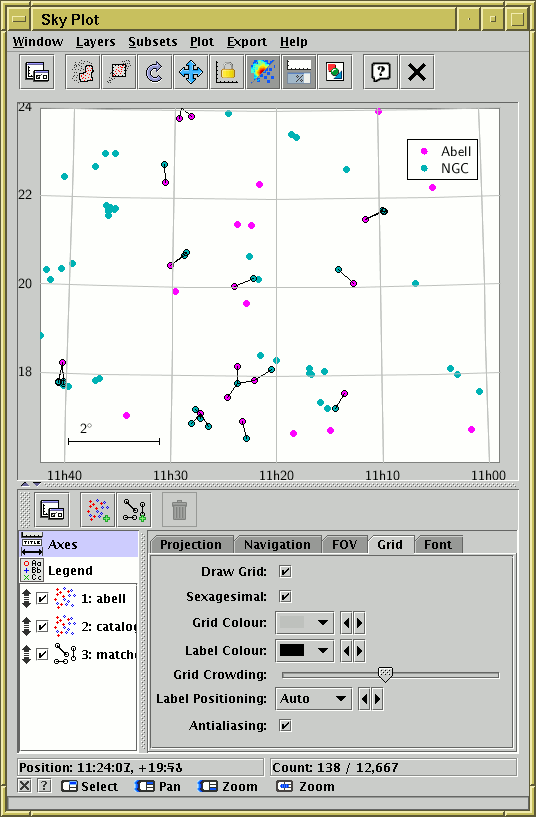
Output from crossmatch Plot Result
It shows clearly which points have been joined. You can fiddle with the plot controls in the usual way to adjust the output (see Appendix A.4). It is also possible to set up such plots by hand.