function
Plots an analytic function. This layer is currently only available for the Plane plots (including histogram).
Usage Overview:
   layerN=function axisN=Horizontal|Vertical xnameN=<name> fexprN=<expr>
                   colorN=<rrggbb>|red|blue|... thickN=<pixels>
                   dashN=dot|dash|...|<a,b,...> antialiasN=true|false
All the parameters listed here
affect only the relevant layer,
identified by the suffix
N.
Example:
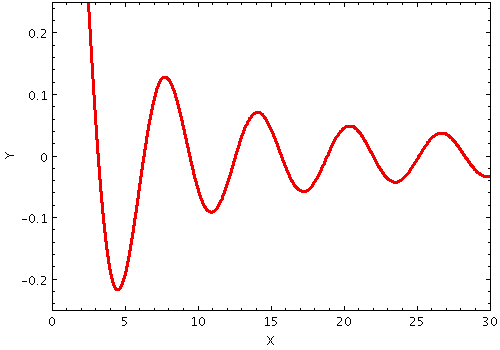
   stilts plot2plane layer1=function fexpr1=sin(x)/x thick1=3
                     xmin=0 xmax=30 ymin=-0.25 ymax=0.25
antialiasN = true|false (Boolean)
[Default: false]
axisN = Horizontal|Vertical (FuncAxis)
Horizontal and
Vertical.
[Default: Horizontal]
colorN = <rrggbb>|red|blue|... (Color)
The standard plotting colour names are
red, blue, green, grey, magenta, cyan, orange, pink, yellow, black, light_grey, white.
However, many other common colour names (too many to list here)
are also understood.
The list currently contains those colour names understood
by most web browsers,
from AliceBlue to YellowGreen,
listed e.g. in the
Extended color keywords section of
the CSS3 standard.
Alternatively, a six-digit hexadecimal number RRGGBB
may be supplied,
optionally prefixed by "#" or "0x",
giving red, green and blue intensities,
e.g. "ff00ff", "#ff00ff"
or "0xff00ff" for magenta.
[Default: red]
dashN = dot|dash|...|<a,b,...> (float[])
Possible values for dashed lines are
dot, dash, longdash, dotdash.
You can alternatively supply a comma-separated list
of on/off length values such as
"4,2,8,2".
fexprN = <expr> (String)
thickN = <pixels> (Integer)
[Default: 1]
xnameN = <name> (String)
x for a horizontal independent variable and
y for a vertical independent variable,
but any string that is a legal expression language identifier
(starts with a letter, continues with letters, numbers,
underscores) can be used.
[Default: x]