gaussian
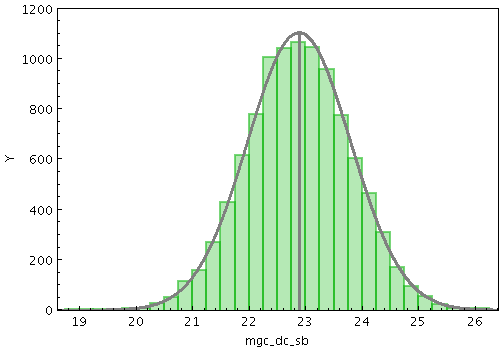
Plots a best fit Gaussian to the histogram of a sample of data. In fact, all this plotter does is to calculate the mean and standard deviation of the sample, and plot the corresponding Gaussian curve. The mean and standard deviation values are reported by the plot.
The normalise config option,
perhaps in conjunction with binsize,
can be used to scale the height of the plotted curve
in data units.
In this case, binsize
just describes the bar width of a notional histogram
whose outline the plotted Gaussian should try to fit,
and is only relevant for some of the normalisation options.
Usage Overview:
   layerN=gaussian colorN=<rrggbb>|red|blue|... showmeanN=true|false
                   sidewaysN=true|false thickN=<pixels>
                   dashN=dot|dash|...|<a,b,...> antialiasN=true|false
                   normaliseN=none|area|unit|maximum|height
                   binsizeN=+<width>|-<count> xN=<num-expr> weightN=<num-expr>
                   inN=<table> ifmtN=<in-format> istreamN=true|false
                   icmdN=<cmds>
All the parameters listed here
affect only the relevant layer,
identified by the suffix
N.
Example:
   stilts plot2plane in=mgc_ok.fits x=mgc_dc_sb
                     layer1=histogram color1=green
                     layer2=gaussian color2=grey thick2=3
                     ymax=1200 shadow=false
antialiasN = true|false (Boolean)
[Default: false]
binsizeN = +<width>|-<count> (BinSizer)
When setting this value graphically, you can use either the slider to adjust the bin count or the numeric entry field to fix the bin width.
[Default: -30]
colorN = <rrggbb>|red|blue|... (Color)
The standard plotting colour names are
red, blue, green, grey, magenta, cyan, orange, pink, yellow, black, light_grey, white.
However, many other common colour names (too many to list here)
are also understood.
The list currently contains those colour names understood
by most web browsers,
from AliceBlue to YellowGreen,
listed e.g. in the
Extended color keywords section of
the CSS3 standard.
Alternatively, a six-digit hexadecimal number RRGGBB
may be supplied,
optionally prefixed by "#" or "0x",
giving red, green and blue intensities,
e.g. "ff00ff", "#ff00ff"
or "0xff00ff" for magenta.
[Default: red]
dashN = dot|dash|...|<a,b,...> (float[])
Possible values for dashed lines are
dot, dash, longdash, dotdash.
You can alternatively supply a comma-separated list
of on/off length values such as
"4,2,8,2".
icmdN = <cmds> (ProcessingStep[])
inN.
The value of this parameter is one or more of the filter
commands described in Section 6.1.
If more than one is given, they must be separated by
semicolon characters (";").
This parameter can be repeated multiple times on the same
command line to build up a list of processing steps.
The sequence of commands given in this way
defines the processing pipeline which is performed on the table.
Commands may alternatively be supplied in an external file,
by using the indirection character '@'.
Thus a value of "@filename"
causes the file filename to be read for a list
of filter commands to execute. The commands in the file
may be separated by newline characters and/or semicolons,
and lines which are blank or which start with a
'#' character are ignored.
A backslash character '\' at the end of a line
joins it with the following line.
ifmtN = <in-format> (String)
inN.
The known formats are listed in Section 5.1.1.
This flag can be used if you know what format your
table is in.
If it has the special value
(auto) (the default),
then an attempt will be
made to detect the format of the table automatically.
This cannot always be done correctly however, in which case
the program will exit with an error explaining which
formats were attempted.
This parameter is ignored for scheme-specified tables.
[Default: (auto)]
inN = <table> (StarTable)
-",
meaning standard input.
In this case the input format must be given explicitly
using the ifmtN
parameter.
Note that not all formats can be streamed in this way.:<scheme-name>:<scheme-args>.<" character at the start,
or a "|" character at the end
("<syscmd" or
"syscmd|").
This executes the given pipeline and reads from its
standard output.
This will probably only work on unix-like systems.istreamN = true|false (Boolean)
inN parameter
will be read as a stream.
It is necessary to give the
ifmtN parameter
in this case.
Depending on the required operations and processing mode,
this may cause the read to fail (sometimes it is necessary
to read the table more than once).
It is not normally necessary to set this flag;
in most cases the data will be streamed automatically
if that is the best thing to do.
However it can sometimes result in less resource usage when
processing large files in certain formats (such as VOTable).
This parameter is ignored for scheme-specified tables.
[Default: false]
normaliseN = none|area|unit|maximum|height (Normalisation)
Note that some of the normalisation options may not make much sense with some other parameter values, for instance averaging aggregation modes.
The available options are:
none: No normalisation is performed.area: The total area of histogram bars is normalised to unity. For cumulative plots, this behaves like height.unit: Histogram bars are scaled by the inverse of the bin width in data units. For cumulative plots, this behaves like none.maximum: The height of the tallest histogram bar is normalised to unity. For cumulative plots, this behaves like height.height: The total height of histogram bars is normalised to unity.[Default: none]
showmeanN = true|false (Boolean)
[Default: true]
sidewaysN = true|false (Boolean)
false,
the quantity being accumulated is on the the horizontal axis
and the frequency is represented vertically as usual.
If set true the quantity accumulated
is on the vertical axis,
and the frequency is represented horizontally,
so that the chart is displayed reflected in the X=Y line.
[Default: false]
thickN = <pixels> (Integer)
[Default: 1]
weightN = <num-expr> (String)
The value is a numeric algebraic expression based on column names as described in Section 10.
xN = <num-expr> (String)
The value is a numeric algebraic expression based on column names as described in Section 10.