Next Previous Up Contents
Next: Layer Controls
Up: Fixed Controls
Previous: Stilts Control
The Aux Axis control ( ) is only visible
when at least one layer is using the shared colour map.
The following plot layers do this:
) is only visible
when at least one layer is using the shared colour map.
The following plot layers do this:
These all colour parts of the plot in a way that is quantitatively
significant, and the Aux Axis control gives you a chance to control
the details of the value-colour mapping,
and to display the mapping in a colour ramp displayed beside the plot.
Some other layer types (e.g. Density mode)
also shade the plot according to numeric values,
but use their own colour map, and don't display the colour ramp.
If no layer is using the shared colour map, then this control
will not appear in the stack.
When present, this control has three tabs,
Map, Ramp and Range,
described below.
Map Tab
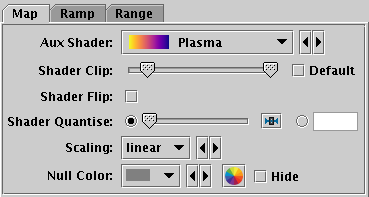
Aux axis control Map tab
The Map tab controls the aux axis colour map.
It has the following options:
-
Aux Shader
- Select the colour map from a list of options.
The available colour maps are listed in Appendix A.4.7.
-
Shader Clip
- Select a sub-range of the full colour map above.
If the Default checkbox is checked, then all or most
of the colour ramp from the Shader control is used.
If you want to configure the range of colours from the map yourself,
uncheck the Default checkbox, and slide the handles in from the end
of the slider to choose exactly the range you want.
The default range is clipped at one end for colour maps that fade
to white, so that all the plotted colours will be distinguishable
against a white background.
That is generally a good idea for scatter-type plots, but may not be
so good for plots where the whole plotting surface is coloured in,
like density maps or spectrograms, so in that case you might want to
uncheck Default and leave the handles at the extreme ends of the slider.
-
Shader Flip
- Whether the aux scale should map forwards or backwards
into the colour map.
-
Shader Quantise
- Allows the colour map to be quantised.
By default, the colour map is effectively continuous.
If you slide the slider to the right,
or enter a value in the text field,
the map will be split into
a decreasing number of discrete colours. This can be used to generate
a contour-like effect, and may make it easier to trace the boundaries
of regions of interest by eye.
-
Scaling
- Determines the function used to map the range of aux data values
onto the colour map. The options are:
-
linear
-
log
-
histogram
-
histolog
-
asinh
-
square
-
sqrt
-
acos
-
cos
In all these cases, the full range of data values is displayed on the
colour bar (though it can be restricted by using the
Aux Subrange control in the Range tab,
described below).
The linear, log, asinh,
square,
sqrt, acos and cos options
just apply the named function to the full data range,
in some cases with some normalisation.
Note that log scaling will ignore any negative values.
The histogram options on the other hand use a scaling function
that corresponds to the actual distribution of the data, so that
there are about the same number of points (or pixels, or whatever
is being scaled) of each colour.
The histogram options are somewhat more expensive,
but can be a good choice if you are exploring data whose
distribution is unknown or not well-behaved over its min-max range.
The histogram and histolog options both
assign the colours in the same way, but they display the colour
ramp with linear or logarithmic annotation respectively;
the histolog option also ignores non-positive values.
-
Null Colour
- What colour should be used to represent points with a null value
for the aux data coordinate.
If the associated Hide option is selected,
then those points will not appear in the plot at all.
Ramp Tab
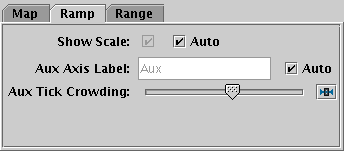
Aux axis control Ramp tab
The Ramp tab controls the display and annotation of
the colour ramp that displays the colour map on the plot.
It has the following options:
-
Show Scale
- Whether the aux scale ramp is visible;
if so an appropriately labelled colour ramp
appears at the right of the plot.
The associated Auto option makes this decision
automatically: if any aux data is plotted, the scale will appear,
otherwise it won't.
Deselect Auto if you want to determine visibility by hand.
-
Aux Axis Label
- Selects the axis label to be displayed near the aux colour ramp
if it is visible.
The associated Auto option, if selected, uses the
name of one of the coordinates supplying aux data;
deselect Auto if you want to enter a label by hand.
-
Aux Tick Crowding
- The slider influences how many tick marks are drawn on the colour ramp.
Range Tab
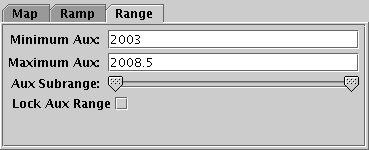
Aux axis control Range tab
The Range tab lets you enter lower and upper values
for the aux data range by hand,
and provides a double slider to restrict the range within these limits.
If either the lower or upper range is left blank,
it will be determined from the data.
The Lock Aux Range checkbox controls whether
the aux range is automatically updated as the plot is adjusted
(for instance as you navigate around it with the mouse).
If locked, the range will stay the same, but otherwise (the default)
it is dynamically updated for the current view of the plot.
This checkbox is a duplicate of the  toggle button on the plot
window toolbar described in Appendix A.4.2.
toggle button on the plot
window toolbar described in Appendix A.4.2.
Note the font used for labelling the aux axis is currently controlled by
the font from the Axes selector.
Next Previous Up Contents
Next: Layer Controls
Up: Fixed Controls
Previous: Stilts Control
TOPCAT - Tool for OPerations on Catalogues And Tables
Starlink User Note253
TOPCAT web page:
http://www.starlink.ac.uk/topcat/
Author email:
m.b.taylor@bristol.ac.uk
Mailing list:
topcat-user@jiscmail.ac.uk