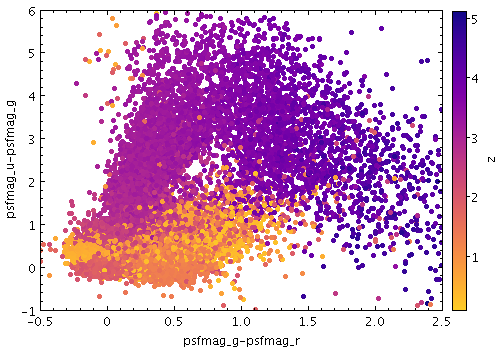
Example Aux shading mode plot
Example Aux shading mode plot
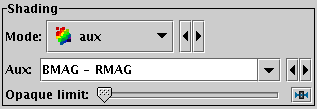
Aux mode selection
The Aux shading mode (![]() )
colours each point according to the value of an additional
data coordinate, using a colour map shared with other layers in the plot.
The point colours then represent an additional dimension.
There is an additional option to draw the points with a fixed transparency.
)
colours each point according to the value of an additional
data coordinate, using a colour map shared with other layers in the plot.
The point colours then represent an additional dimension.
There is an additional option to draw the points with a fixed transparency.
The shading is done using the shared colour map. This colour map is used by all currently visible Aux, Weighted, Grid and SkyDensity layers. When at least one such layer is being plotted, the Aux Axis control is visible in the control panel, which allows you to configure the colour map, range, ramp display etc.
The options are:
Exporting: Transparent points are rendered in PDF output, though the transparency levels may not be exactly the same as on the screen. This can be fixed by using the Force Bitmap option in the Plot Export dialogue. For PostScript, transparent points are rendered as opaque. You can use Force Bitmap with PostScript which will get transparency right for this layer, but then any earlier layers will be completely obscured.