Next Previous Up Contents
Next: Marks Form
Up: Plot Forms
Previous: AreaLabel Form
The Lines form ( ),
available from the
XYArray Layer Control,
draws a point-to-point line joining all the elements of X, Y
array-valued coordinates, resulting in one line for each table row.
It is typically used to plot a number of spectra or time series.
),
available from the
XYArray Layer Control,
draws a point-to-point line joining all the elements of X, Y
array-valued coordinates, resulting in one line for each table row.
It is typically used to plot a number of spectra or time series.
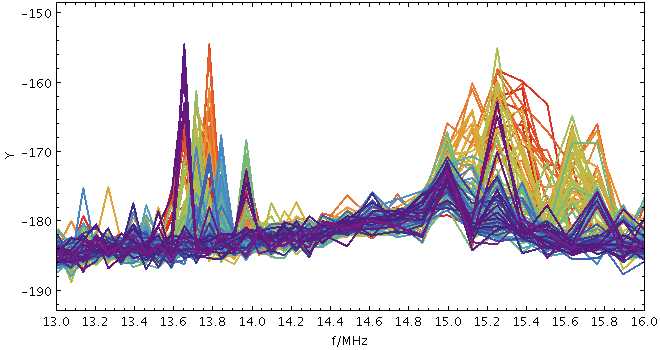
Example Lines plot
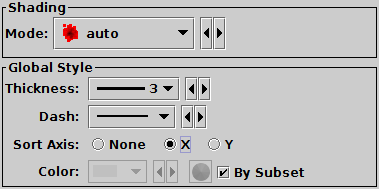
Lines form configuration panel
The configuration options are:
-
Shading mode
- See Appendix A.4.6.
-
Thickness
- Line thickness in pixels.
-
Dash
- Dash pattern. The line is solid by default.
-
Sort Axis
- May be used to sort the points before the lines are drawn.
By default (option None) the lines are drawn between
the points in the sequence in which they appear in each array.
But if you set it to X or Y
the points will be pre-ordered along the given axis,
so that lines for unordered arrays will come out looking like
a function of the X or Y coordinate rather than a scribble.
Next Previous Up Contents
Next: Marks Form
Up: Plot Forms
Previous: AreaLabel Form
TOPCAT - Tool for OPerations on Catalogues And Tables
Starlink User Note253
TOPCAT web page:
http://www.starlink.ac.uk/topcat/
Author email:
m.b.taylor@bristol.ac.uk
Mailing list:
topcat-user@jiscmail.ac.uk