The XYArray layer control (![]() )
can be used to plot points, lines and error bars,
but unlike the Position Layer Control
it works with table cells whose values are arrays giving multiple coordinates,
rather than single values.
It is typically used where the value stored in each cell of a column
is an array representing a whole spectrum or time series,
or some related quantity (such as errors, frequencies, epochs etc).
Each row of the table therefore corresponds to a full spectrum,
timeseries, or other array of coordinate pairs.
)
can be used to plot points, lines and error bars,
but unlike the Position Layer Control
it works with table cells whose values are arrays giving multiple coordinates,
rather than single values.
It is typically used where the value stored in each cell of a column
is an array representing a whole spectrum or time series,
or some related quantity (such as errors, frequencies, epochs etc).
Each row of the table therefore corresponds to a full spectrum,
timeseries, or other array of coordinate pairs.
You can add one of these controls to the Plane plot stack by using the
Add XYArray Control (![]() ) button
in the control panel toolbar,
or the corresponding item in the Layers menu.
You may need to deactivate the default
Position Layer Control stack entry (
) button
in the control panel toolbar,
or the corresponding item in the Layers menu.
You may need to deactivate the default
Position Layer Control stack entry (![]() ) as well
to avoid confusion and make sure the ranging works correctly.
This control is only available for the
Plane plot.
) as well
to avoid confusion and make sure the ranging works correctly.
This control is only available for the
Plane plot.
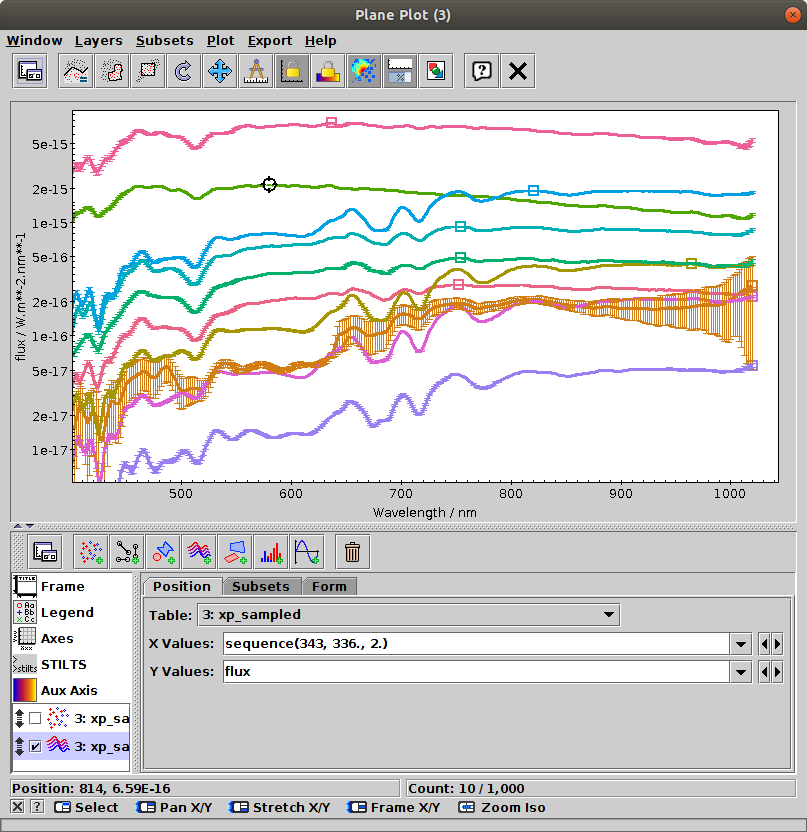
Plane Plot window with an XYArray layer
Note that unlike for instance plots of simple X,Y positions,
there is no obvious single position associated with each plotted row
(X/Y array pair, or wiggly line).
That means that by default, you can't click on a plotted line to
activate it,
or see it highlighted when you activate the corresponding row by
clicking on it in the Data Window.
To do that, you can use the
Handles Form (![]() ),
which plots a "handle" marker at some configurable
reference position near each line.
That then serves as the effective position on the plot for each row
for the purposes of activation, highlighting, graphical subset definition, etc.
For convenience, a disabled Handles entry is added by default to the
stack in the Forms tab,
so you can enable it just by clicking on its checkbox.
The handle positions and appearance can be adjusted using
the configuration panel.
),
which plots a "handle" marker at some configurable
reference position near each line.
That then serves as the effective position on the plot for each row
for the purposes of activation, highlighting, graphical subset definition, etc.
For convenience, a disabled Handles entry is added by default to the
stack in the Forms tab,
so you can enable it just by clicking on its checkbox.
The handle positions and appearance can be adjusted using
the configuration panel.
This control is a Table Data control as described in Appendix A.4.2.2. That section explains the Subsets tab; the Position and Form tabs are described in more detail below.
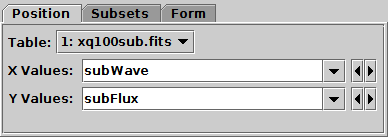
Position tab of XYArray layer control
In the Position tab you have to fill in
array values for the X Values and Y Values
plot coordinates.
The contents can be array-valued column names or expressions.
For each row, the X and Y coordinates must be arrays of the same length
(if they are not, nothing will be plotted for that row),
though different rows may have different array lengths.
To manipulate array values, some of the expression language functions
in the Arrays class may be useful;
for instance the expression "multiply(flux,1./mean(flux))"
can be used to normalise an input flux array.
For most of the available plots, if either the X or Y array value is missing,
it will be interpreted as a sequence (0,1,2,...) of the same length
as the array that is present.
TOPCAT will try to fill in the X and Y coordinates with suitable
array values from the table, if it can find some.
As well as array-valued columns, array-valued table parameters
can be used, and are often suitable for the X axis;
these can be referred to using the syntax "param$<name>",
as explained in Section 7.3.
It helps if columns are declared with fixed array sizes, where applicable.
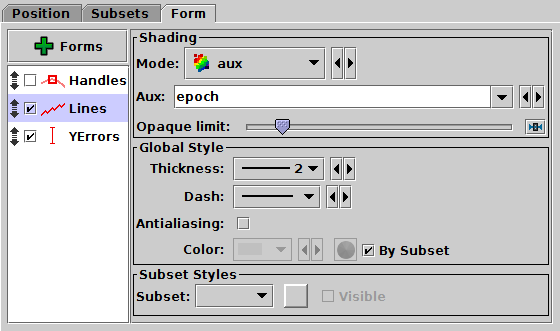
Form tab of XYArray layer control
The Form tab lets you define how the specified data set is plotted. The list on the left gives a list of forms currently being plotted, and the panel on the right shows the detailed configuration for the currently selected form.
The available forms for an XYArray plot
(select them using the ![]() Forms button)
are currently
Forms button)
are currently