s_region column of
ObsCore or EPN-TAP query results),
as an array specification of polygons or circles,
or as an ASCII-encoded MOC.
You can add one of these controls to the stack by using the
Add Area Control (The Area layer control (![]() )
allows you to plot a two-dimensional shape from each row of a table.
This might typically be something like an instrument coverage footprint
corresponding to an observation.
The shape may be specified in various different ways:
as an STC-S region specification string
(as found for instance in the
)
allows you to plot a two-dimensional shape from each row of a table.
This might typically be something like an instrument coverage footprint
corresponding to an observation.
The shape may be specified in various different ways:
as an STC-S region specification string
(as found for instance in the s_region column of
ObsCore or EPN-TAP query results),
as an array specification of polygons or circles,
or as an ASCII-encoded MOC.
You can add one of these controls to the stack by using the
Add Area Control (![]() ) button
in the control panel toolbar
or the corresponding item in the Layers menu
for suitable plot types
(Plane,
Sky or
Sphere).
) button
in the control panel toolbar
or the corresponding item in the Layers menu
for suitable plot types
(Plane,
Sky or
Sphere).
Areas specified in this way are generally intended for displaying relatively small shapes such as instrument footprints. Larger areas may also be specified, but there may be issues with use, for instance auto-determination of the initial plot region may not work so well, and the rendering of shapes that are large relative to the sky may be inaccurate. These issues may be addressed in future releases.
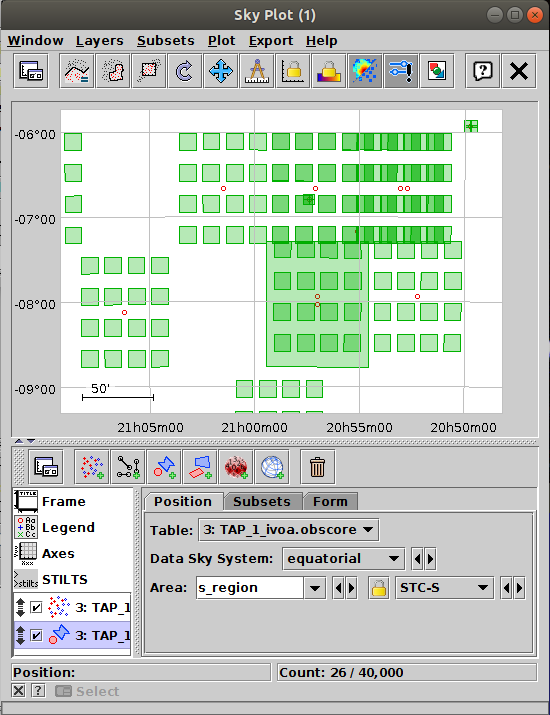
Sky Plot Window with an Area control
This control is a Table Data control as described in Appendix A.4.2.2. That section explains the Subsets tab; the Position and Form tabs are described in more detail below.
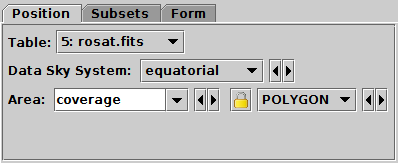
Position tab of Area layer control, for Sky Plot
In the Position tab, you just need to
select the input table using the Table selector,
and then supply the expression for the region specification
in the Area selector.
This area value will typically be a table column containing the relevant
information, for instance the s_region column
in tables resulting from an ObsCore or EPN-TAP query.
However, it's also possible to enter a suitable expression,
for instance "array(RA,DEC,RADIUS)" if you want
to specify a CIRCLE-format shape given position and radius
columns in the table.
The area may be specified in various formats, currently:
<frame>, <refpos> and
<flavor> metadata are ignored,
polygon winding direction is ignored (small polygons are assumed)
and the INTERSECTION and NOT
constructions are not supported.
The non-standard MOC construction is supported.
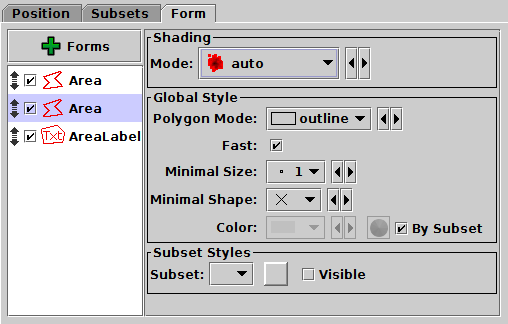
Form tab of Area layer control
The Form tab lets you define how the specified region data will be plotted. The list on the left gives a list of forms currently being plotted, and the panel on the right shows the detailed configuration for the currently selected form.
The following forms are currently available for the Area plot:
You can add a new form using the ![]() Forms button.
Each such form can be configured separately using a panel
divided into two parts:
Forms button.
Each such form can be configured separately using a panel
divided into two parts: