Plane Plot Window
Plane Plot Window
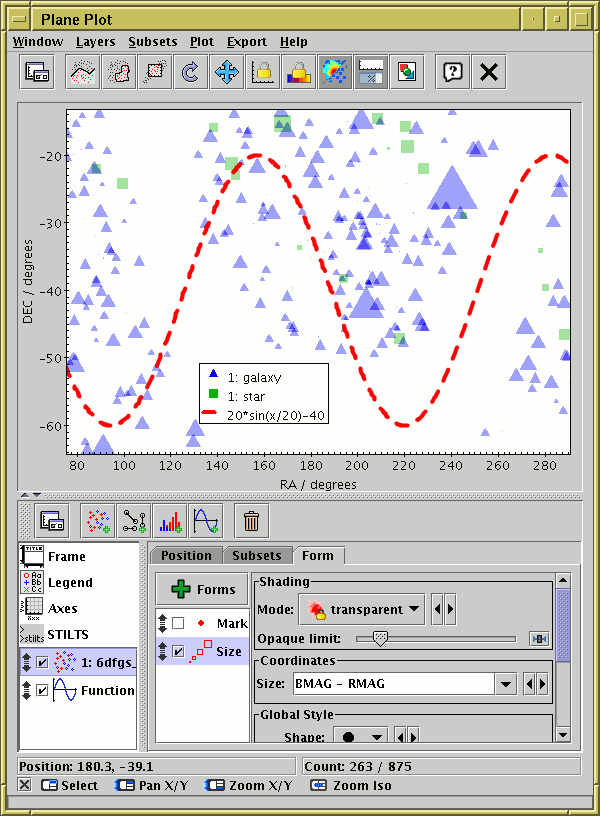
The Plane Plot (![]() )
plots 2-dimensional Cartesian positions on a plane.
The positional coordinates are X and Y.
To control the direction and linear/log scaling of the axes,
see the Coords tab of the
Axes control.
)
plots 2-dimensional Cartesian positions on a plane.
The positional coordinates are X and Y.
To control the direction and linear/log scaling of the axes,
see the Coords tab of the
Axes control.
The Plane Plot offers the following plot controls:
As well as the standard actions, this window additionally provides the following toolbar buttons:
and Subsets menu itemSee the Window Overview for features common to all plotting windows. The following subsections describe navigation and axis configuration.