Time Plot Window
Time Plot Window
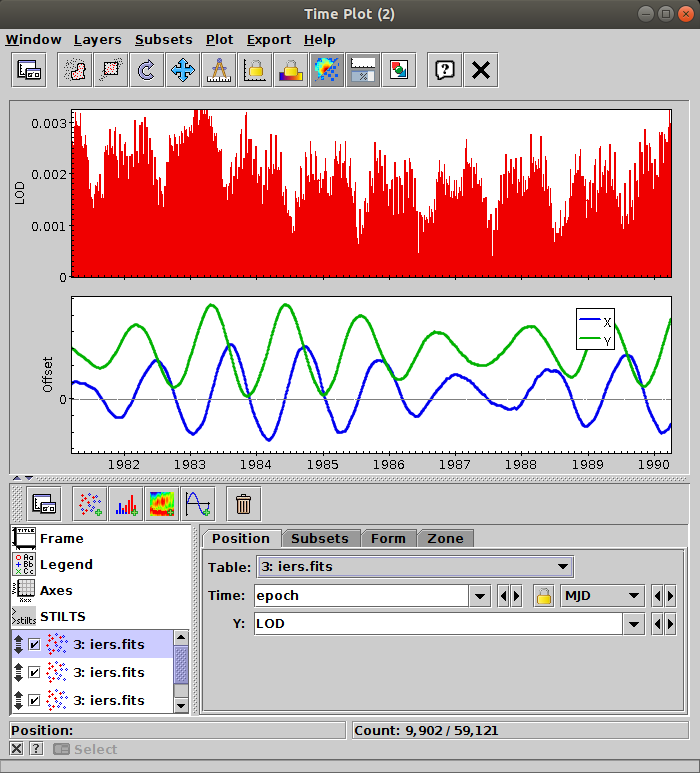
The Time Plot (![]() )
is intended for plotting time series data.
)
is intended for plotting time series data.
The horizontal axis represents time, and can be labelled accordingly (for instance in minutes, hours, days, months and years), and the window can display appropriate types of plot including spectrograms.
To define the time coordinate, use the Time selector in position tabs as usual. Note however that this contains a time format selector on the right hand side that indicates how the selected quantity will be interpreted as a time value. The options are:
Unlike most of the other plot windows the Time plot can display different data plots in different plot Zones stacked vertically on top of each other, so that different plots share a time axis but have their own Y axis. The vertical spacing between the stacked plots can be configured using the Cell Gap configuration option in in the Spacing tab of the Frame Control.
It is possible to abuse this plot type to stack plots that do not actually have time on the horizontal axis. To do that, select mjd as the Time Format in the Grid tab of the Axes Control, and make sure that any time format selectors (described above) are similarly set to MJD. You may need to check that the right Zone is chosen (usually the bottom one) when you configure the axes.
The Time Plot offers the following plot controls:
As well as the standard actions, this window additionally provides the following toolbar button:
See the Window Overview for features common to all plotting windows. The following subsections describe zones, navigation and axis configuration.