weighted
Paints markers like the Density mode, but with optional weighting by an additional coordinate; the colour map is shared between layers. You can configure how the weighted coordinates are combined to give the final weighted result. The way that data values are mapped to colours is usually controlled by options at the level of the plot itself, rather than by per-layer configuration.
Usage:
   shadingN=weighted weightN=<num-expr> colorN=<rrggbb>|red|blue|...
                     combineN=sum|count|mean|median|...
All the parameters listed here
affect only the relevant layer,
identified by the suffix
N.
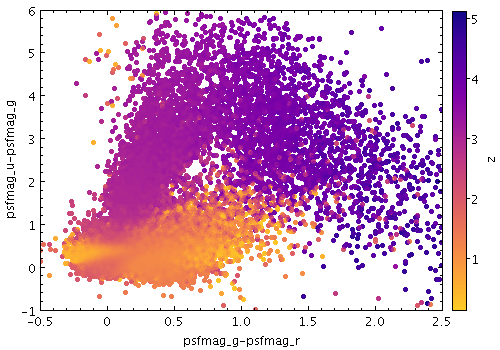
Example:
   stilts plot2plane layer1=mark in1=dr5qso.fits
                     x1=psfmag_g-psfmag_r y1=psfmag_u-psfmag_g size1=2
                     shading1=weighted weight1=z auxmap=plasma
                     xmin=-0.5 xmax=2.5 ymin=-1 ymax=6
Associated parameters are as follows:
colorN = <rrggbb>|red|blue|... (Color)
The standard plotting colour names are
red, blue, green, grey, magenta, cyan, orange, pink, yellow, black, light_grey, white.
However, many other common colour names (too many to list here)
are also understood.
The list currently contains those colour names understood
by most web browsers,
from AliceBlue to YellowGreen,
listed e.g. in the
Extended color keywords section of
the CSS3 standard.
Alternatively, a six-digit hexadecimal number RRGGBB
may be supplied,
optionally prefixed by "#" or "0x",
giving red, green and blue intensities,
e.g. "ff00ff", "#ff00ff"
or "0xff00ff" for magenta.
[Default: red]
combineN = sum|count|mean|median|... (Combiner)
When a weight is in use,
mean or
sum
are typically sensible choices.
If there is no weight (a pure density map)
then count is usually better,
but in that case it may make more sense
(it is more efficient)
to use one of the other shading modes instead.
The available options are:
sum: the sum of all the combined values per bincount: the number of non-blank values per bin (weight is ignored)mean: the mean of the combined valuesmedian: the medianq1: first quartileq3: third quartilemin: the minimum of all the combined valuesmax: the maximum of all the combined valuesstdev: the sample standard deviation of the combined valuesstdev_pop: the population standard deviation of the combined valueshit: 1 if any values present, NaN otherwise (weight is ignored)[Default: mean]
weightN = <num-expr> (String)
This parameter gives a column name, fixed value, or algebraic expression for the
weight coordinate
for layer N.
The value is a numeric algebraic expression based on column names
as described in Section 10.