Next Previous Up Contents
Next: Load Window
Up: Density Map (old-style)
Previous: Density Map (old-style)
For a density map in RGB mode, each dataset
is assigned a colour channel to which it contributes. A representation
of this is displayed in a button to the right of its name in the dataset
selector panel at the bottom of the density map window.
If you click this button the following dialogue will pop up which
enables you to change the colour channel.
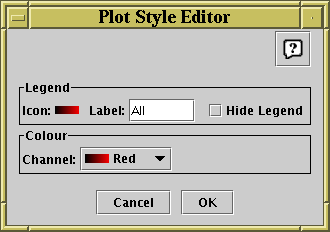
Style editor dialogue for density map
The Legend box defines how the selected set will
be identified in the legend which appears alongside the plot
(though the legend will only be visible if Show Legend
( ) is on):
-
Icon
- Displays the icon which will be shown to identify the points in
the selected set. Its appearance depends on the selections you
make in the rest of this dialogue window.
-
Label
- Gives the name written in the legend to label the subset.
By default this is derived from the Row Subset's name and, if it's
not part of the main dataset, the name of the dataset's tab.
You can type in a new value to change what is written in the legend.
-
Hide Legend
- If this checkbox is selected, then no entry for the selected set
will appear in the legend.
The Channel selector allows you to select either
the Red, Green or Blue channel for this dataset to contribute to.
Note that this is only enabled in RGB mode; in indexed mode
it has no effect and is disabled.
Next Previous Up Contents
Next: Load Window
Up: Density Map (old-style)
Previous: Density Map (old-style)
TOPCAT - Tool for OPerations on Catalogues And Tables
Starlink User Note253
TOPCAT web page:
http://www.starlink.ac.uk/topcat/
Author email:
m.b.taylor@bristol.ac.uk
Mailing list:
topcat-user@jiscmail.ac.uk