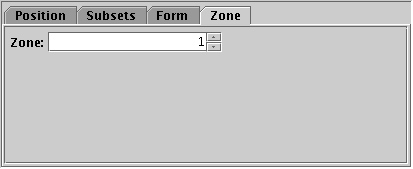
Zone selection tab
Unlike the other plot types, the Time plot can display data in multiple panels, known as Zones, stacked vertically. All plots therefore share the same time axis, but can have different Y axes.
By default, each new plot added is displayed in a new zone stacked beneath the existing ones. By using the Zone tab for each plot however, you can control which plots appear in which zones. Each zone has a numeric identifier, which by default increments by one for each new plot, but if you select the same identifier for several plots, they will all appear in the same zone.
Zone selection tab
Some of the fixed controls
(Axes ![]() and
Aux
and
Aux ![]() )
operate on a per-zone basis.
If multiple zones are visible, then a zone selector is displayed
above the tabs:
)
operate on a per-zone basis.
If multiple zones are visible, then a zone selector is displayed
above the tabs:
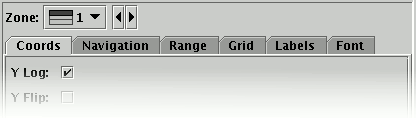
Zone selector for Axes Control
In this case you should select the zone you want to control and adjust the configuration for that zone only. The selector shows an icon indicating the position of the zone in question. Each zone has to be configured separately. In a future release a global zone configuration option may be introduced as well.
This multi-zone feature is currently available only for the Time plot, but it may be added to other plot types at some point in the future.