Next Previous Up Contents
Next: Plane Plot Window
Up: Histogram Plot Window
Previous: Histogram Axes Control
The Bins control ( )
is found in the control stack of the
Histogram window.
It configures the common placement and calculation of some options
for all the histogram-like layers displayed.
Being able to set these values in common for all displayed layers
of a similar type can be convenient, but if you need to use different
parameters for different datasets, you can plot the same layer forms
in the Plane window
(which has no fixed Bins control) instead.
)
is found in the control stack of the
Histogram window.
It configures the common placement and calculation of some options
for all the histogram-like layers displayed.
Being able to set these values in common for all displayed layers
of a similar type can be convenient, but if you need to use different
parameters for different datasets, you can plot the same layer forms
in the Plane window
(which has no fixed Bins control) instead.
There are three tabs:
Histogram,
KDE and
General,
described below.
Histogram Tab
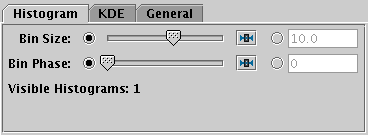
Histogram tab of histogram window Bins fixed control
The Histogram tab affects all
Histogram layers,
and to some extent the Gaussian layer,
and has the following controls:
-
Bin Size
- A scale for the width of bins that are shown on the screen.
There are two ways to specify this.
If the left-hand radio button is selected, the adjacent slider will
adjust the bin size, which is also affected by the actual width of
the plotting window in pixels. Slide the slider left to get narrower
bins or right to get wider ones.
If the right-hand radio button is selected, you can enter a numeric
value giving the actual width in data units of each bar
(for a logarithmic X axis this value is a factor).
Although Gaussian layers don't have bars,
the value of this control can affect the scaling of plotted gaussian fits
for some normalisation options, since the Gaussian plots try to scale
themselves to match the height of corresponding histograms.
-
Bin Phase
- Controls where the horizontal zero point for binning is set.
For instance if your bin size is 1, it controls whether bin
boundaries are at 0, 1, 2, .. or 0.5, 1.5, 2.5, ... etc.
If the slider is at either end of the scale, there will be a bin
boundary at X=0 (linear X axis) or X=1 (logarithmic X axis).
KDE Tab
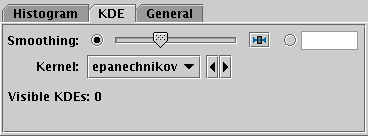
KDE tab of histogram window Bins fixed control
The KDE (Kernel Density Estimate) tab affects all
KDE,
KNN and
Densogram layers,
and has the following controls:
-
Smoothing
- Configures the smoothing width for kernel density estimation. This is
the characteristic width of the kernel function to be convolved with
the density to produce the visible plot.
Sliding the slider to the right makes the kernel width larger.
The width in data units is shown in the text field on the right
(if the X axis is logarithmic, this is a factor).
Alternatively you can click the radio button near the text field,
and enter the width in data units directly.
Note this affects KDE and Densogram layers,
but not KNN layers, which have their own smoothing controls.
-
Kernel
- The functional form of the smoothing kernel. The functions listed
refer to the unscaled shape; all kernels are normalised to give a
total area of unity.
The available options are:
-
square:
Uniform value: f(x)=1, |x|=0..1
-
linear:
Triangle: f(x)=1-|x|, |x|=0..1
-
epanechnikov:
Parabola: f(x)=1-x*x, |x|=0..1
-
cos:
Cosine: f(x)=cos(x*pi/2), |x|=0..1
-
cos2:
Cosine squared: f(x)=cos^2(x*pi/2), |x|=0..1
-
gauss3: Gaussian truncated at 3.0 sigma:
f(x)=exp(-x*x/2), |x|=0..3
-
gauss6: Gaussian truncated at 6.0 sigma:
f(x)=exp(-x*x/2), |x|=0..6
General Tab
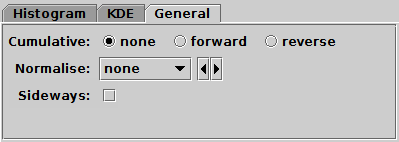
General tab of histogram window Bins fixed control
The General tab affects all histogram-like layers,
and has the following controls:
-
Cumulative
- If set to forward or reverse,
the bin values are calculated cumulatively;
each bin includes the counts from all previous bins in the
direction of negative or positive infinity.
-
Normalise
- Defines how, if at all, the bars are normalised.
The available options are:
-
none:
No normalisation is performed.
-
area:
The total area of histogram bars is normalised to unity.
For cumulative plots, this behaves like height.
-
unit:
Histogram bars are scaled by the inverse of the bin width in data units.
For cumulative plots, this behaves like none.
-
maximum:
The height of the tallest histogram bar is normalised to unity.
For cumulative plots, this behaves like height.
-
height:
The total height of histogram bars is normalised to unity.
-
Sideways
- Controls the orientation of the histogram.
By default the quantity being accumulated is on the horizontal axis
and the frequencies are represented vertically.
But if this option is set, the quantity accumulated is on the vertical axis
and the frequencies are represented horizontally,
so the chart is displayed reflected in the X=Y line.
Next Previous Up Contents
Next: Plane Plot Window
Up: Histogram Plot Window
Previous: Histogram Axes Control
TOPCAT - Tool for OPerations on Catalogues And Tables
Starlink User Note253
TOPCAT web page:
http://www.starlink.ac.uk/topcat/
Author email:
m.b.taylor@bristol.ac.uk
Mailing list:
topcat-user@jiscmail.ac.uk