Next Previous Up Contents
Next: Histogram Navigation
Up: Plot Windows
Previous: Colour Maps
Histogram Plot Window
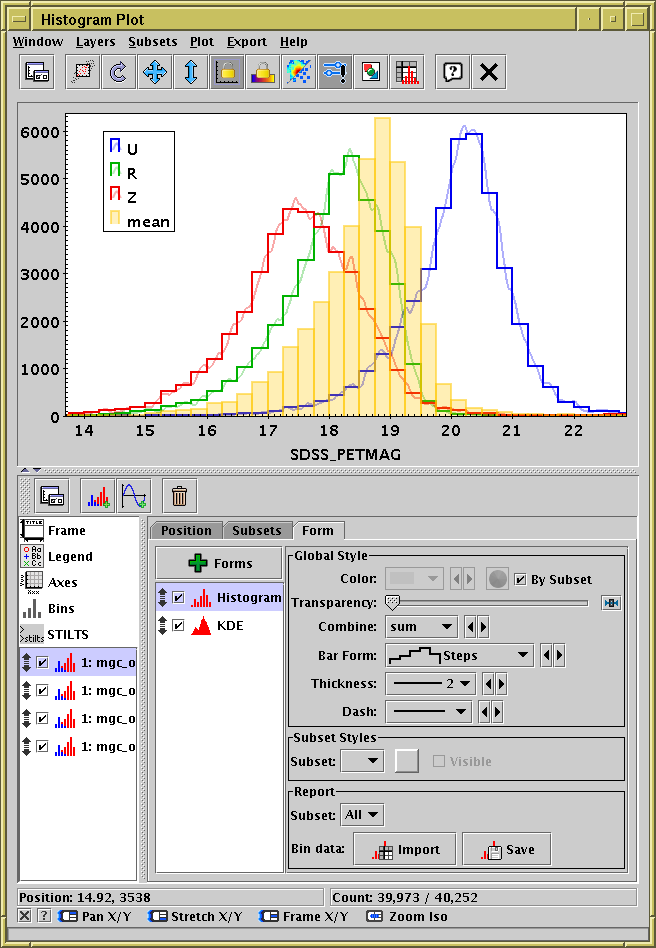
The Histogram Plot ( )
plots 1-dimensional histograms and some variants on the idea of a
1-dimensional Kernel Density Estimate.
In many respects it works like the Plane Plot,
but it has a restricted set of plot types
and an additional fixed control
Bins,
and the scrolling works a bit differently.
)
plots 1-dimensional histograms and some variants on the idea of a
1-dimensional Kernel Density Estimate.
In many respects it works like the Plane Plot,
but it has a restricted set of plot types
and an additional fixed control
Bins,
and the scrolling works a bit differently.
See the Window Overview
for features common to all plotting windows.
As well as the standard actions,
this window additionally provides the following toolbar buttons:
-
 Rescale Y
- Adjusts the vertical range of the visible data region
to accommodate all the histogram bars in the currently
visible horizontal region of the plot.
The horizontal range is not changed.
-
 Measure Distance
In addition, the histogram window lets you export the binned data as
a new table, either saving it or loading it directly into TOPCAT's
table list.
The following actions are available in the Export menu;
note they only apply to histograms proper, not to KDEs:
-
 Save as Table
- The bin counts/sums corresponding to the currently plotted histogram
will be written to disk in tabular form. The first two columns give
the lower and upper bounds of each bin, and the subsequent columns
give the occupancies of each bin for each plotted data set.
If only one dataset is plotted, there will only be three columns.
-
 Import as Table
- Assembles a table as per the Save option above,
but rather than writing it to disk imports it directly into TOPCAT,
where it can be manipulated in all the usual ways.
The Histogram Plot offers the following plot controls:
The following subsections describe
navigation,
axis configuration and
bin configuration.
Next Previous Up Contents
Next: Histogram Navigation
Up: Plot Windows
Previous: Colour Maps
TOPCAT - Tool for OPerations on Catalogues And Tables
Starlink User Note253
TOPCAT web page:
http://www.starlink.ac.uk/topcat/
Author email:
m.b.taylor@bristol.ac.uk
Mailing list:
topcat-user@jiscmail.ac.uk