Next Previous Up Contents
Next: Distance Measurement
Up: Plot Window Overview
Previous: Draw Algebraic Subset
Cartesian axes with various scaling options are used in the
Plane,
Cube and
Time plot windows.
By default, these axes are scaled linearly, meaning a constant difference
in data values maps to a constant distance on the plot axis,
but other scalings can be chosen.
The available options, mapping data coordinate d to a position
on the graphical axis g are:
-
Linear
- Linear scaling, g ∝ d.
-
Log
- Logarithmic scaling, g ∝ log(d).
Note that only positions strictly greater than zero
can appear on the axis with this scaling,
since log(x) is negative infinity for x=0,
and undefined for x<0.
-
Asinh
- Hyperbolic arcsine scaling, g ∝ sinh-1(d/a).
This function approximates to linear near the origin,
and to positive or negative logarithmic
(ln(d/2a) or -log(-d/2a))
for large positive or negative values.
The parameter a dictates the approximate value of
the smooth crossover between these regimes, and must be greater than zero.
This scaling can thus accommodate a wide dynamic range
like Log, but unlike Log it works with
negative as well as positive values.
This function is available from the expression language as
asinh(x/a).
-
Symlog
- So-called Symmetric Logarithmic scaling,
g ∝ {|d|<= t : d/s;
d < -t : -s - log10(-d) + log10(t);
d > t : s + log10(d) - log10(t)}
.
The parameters t and s are also known as linthresh
and linscale respectively.
This provides linear scaling within a distance t
of the origin, and positive or negative logarithmic scaling outside
of that region.
The s parameter is the ratio of the half-extent of the
linear region to the extent of a decade in the logarithmic region.
Both parameters must be greater than zero.
The transition between the two regimes is abrupt
and derivatives of the function there are in general discontinuous.
This function is available from the expression language as
symlog(t,s,x).
It was copied from the
matplotlib scale of the same name.
A plot comparing these scaling functions on linear axes is shown
for reference below:
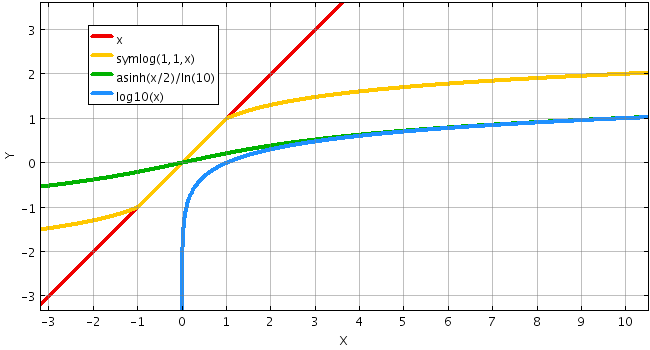
Scaling functions shown on linear axes.
These scales are selected for use
in the Coords tab of the Axis Control for
Plane,
Cube and
Time plot windows.
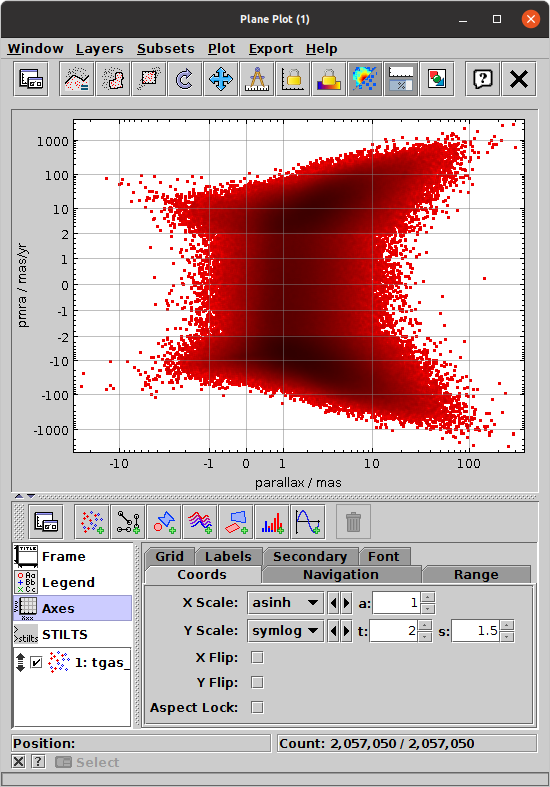
2d scatter plot using asinh and symlog axis scalings
You can select one of the options from the Scale
selectors in the normal way using the drop-down list or the little
left-right arrows to cycle through the choices.
Some of these options (Asinh and Symlog)
require parameters, and labelled entry boxes will appear next
to the selector when they are selected.
To adjust them you can either type in a number or use the tiny
up-down arrows to step through larger or smaller values.
Hovering over the entry box will pop up a tooltip explaining its meaning.
Next Previous Up Contents
Next: Distance Measurement
Up: Plot Window Overview
Previous: Draw Algebraic Subset
TOPCAT - Tool for OPerations on Catalogues And Tables
Starlink User Note253
TOPCAT web page:
http://www.starlink.ac.uk/topcat/
Author email:
m.b.taylor@bristol.ac.uk
Mailing list:
topcat-user@jiscmail.ac.uk