Cube Plot Window
Cube Plot Window
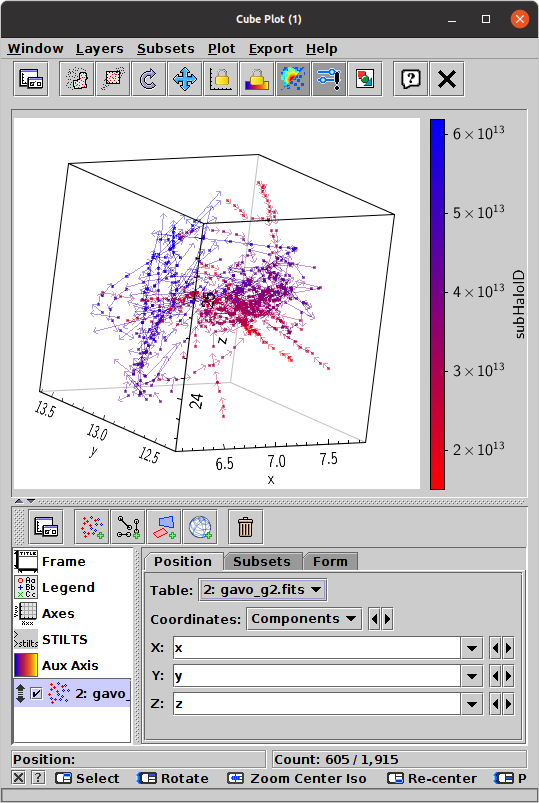
The Cube Plot (![]() )
plots 3-dimensional Cartesian positions in a 3-d space.
)
plots 3-dimensional Cartesian positions in a 3-d space.
By default the positional coordinates are X, Y and Z, but the Coordinates selector lets you specify them in different ways:
To control the direction and linear/logarithmic scaling of the axes, see the Coords tab of the Axes control.
The cube plot offers the following plot controls:
As well as the standard actions, this window additionally provides the following toolbar button:
and Subsets menu item:Note that use of the Auto, Density and Weighted shading modes can be confusing in 3 dimensions with multiple datasets. This is because pixels based on density along a line of sight are not located at any point on that line, so shaded pixels can't appear at the "right" place in the 3-d space. The same applies to a lesser extent with contours. They work fine with a single dataset though.
See the Window Overview for features common to all plotting windows. The following subsections describe navigation and axis configuration.