Next Previous Up Contents
Next: Navigation
Up: Plot Windows
Previous: Differences From Old-Style Plot Windows
Plot window
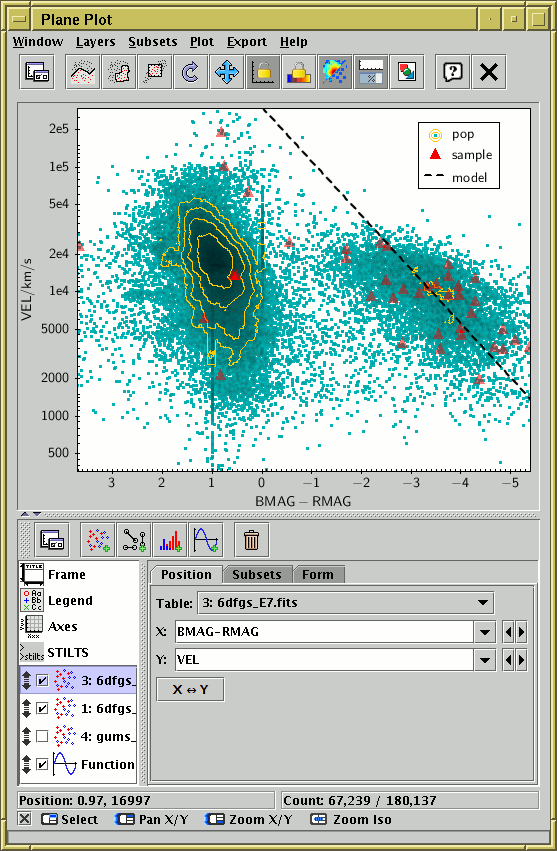
Plot windows consist of two main parts:
the Plot Panel containing the actual plotted graphics
(by default, at the top),
and the Control Panel (by default, at the bottom).
The Control Panel is where you configure what will be plotted.
For a simple scatter plot it may just be a case of selecting what
columns to plot against each other, but it can get quite detailed.
If you want more screen space to play with, it can be helpful
to float the control panel into a separate window using the
Float Controls ( ) toolbar button;
you can find this button in both the main and the control panel toolbars.
To unfloat the control panel, either just close the control panel window,
or click the Float Controls toolbar button again.
With floating controls, the window looks like the following figure.
) toolbar button;
you can find this button in both the main and the control panel toolbars.
To unfloat the control panel, either just close the control panel window,
or click the Float Controls toolbar button again.
With floating controls, the window looks like the following figure.
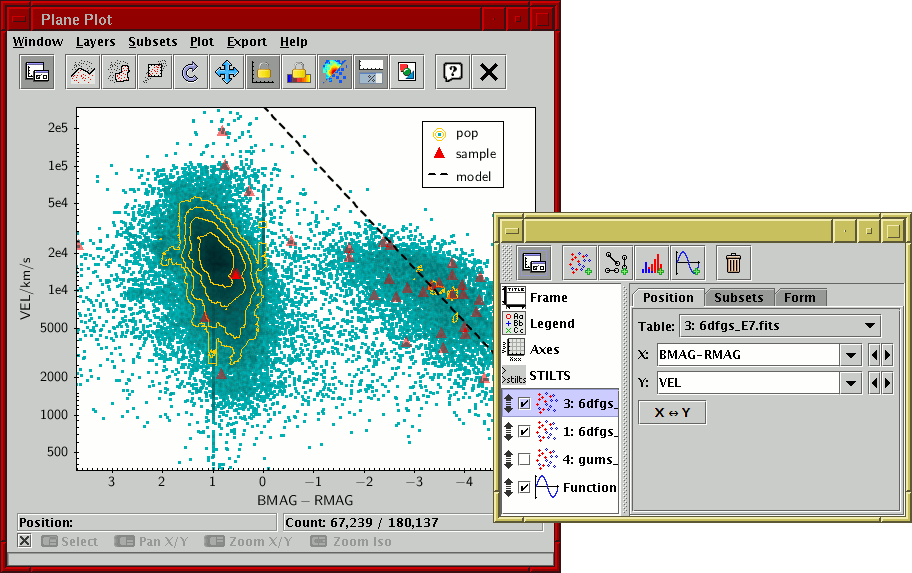
Plot window with floated control panel
The control panel
itself has two main parts: a control stack on the left
containing currently active controls (represented by names and icons),
and a detail panel
on the right which shows information about the currently selected control.
Click on one of the control entries on the left to see its details
on the right.
Different controls have different detail panels, but in general each
one will have multiple tabs for configuring different things.
You can select these by clicking on the tab names.
A good way to learn about the options is to click on
the different controls and their tabs to see what's available
and experiment with the various options to see what happens to the plot,
but all the panels and tabs are also explained in this manual.
The control panel also has a toolbar at the top, used for
adding and removing controls from the stack.
The control list has two types of entry:
-
Fixed controls:
- These control the overall plot appearance.
In the above figure, the fixed controls
Frame (
 ),
Legend (
),
Legend ( ),
Axes (
),
Axes ( ) and
STILTS (
) and
STILTS ( ) are visible.
The different fixed controls are described in
Appendix A.4.3.
-
Layer controls:
- These determine the actual data that will be plotted and what
graphical form it takes; each control contributes a layer or
layers to the plot.
To add a layer control, use the toolbar just above; each button
with a little green "+" adds a control of the corresponding type.
To remove a layer control, select it and use the
Remove Current Layer (
 ) button in the
toolbar. You can also use the Layers menu at the top
of the main window to add and remove layers.
) button in the
toolbar. You can also use the Layers menu at the top
of the main window to add and remove layers.
The checkbox beside each control determines whether it is currently
active; if unchecked, any plotting instructions is contains will be
ignored.
You can set them active or inactive by clicking on the checkboxes.
You can also drag each control up or down by dragging with the
grab handle ( ). Layers lower down the list are plotted
later (perhaps obscuring earlier one), so you can drag them up and
down until you have the layers you want on top.
). Layers lower down the list are plotted
later (perhaps obscuring earlier one), so you can drag them up and
down until you have the layers you want on top.
The different layer controls are described in
Appendix A.4.4.
In the foot of the window, there are also four other small panels:
-
Position Panel
- When the cursor is positioned over the plot itself, this reports
its position in data coordinates. In some cases, such as
3-d plots, this may not be possible, in which case it's blank.
-
Count Panel
- Displays the number of points currently plotted
and the total number of points represented by the plot.
The total (the second figure) is the number of positions in all
the plotted data sets, and the current number (the first figure)
excludes those in subsets not currently plotted and those outside
the bounds of the visible plot.
-
Navigation Help
- Shows some reminders for what different mouse gestures do.
Little icons are supposed to represent clicking and dragging different
mouse buttons and the mouse wheel. Note the content changes according
to where the mouse is on the plot, since that affects navigation
behaviour. For more information see Appendix A.4.2.1.
Clicking on the
 button
will make this panel go away.
button
will make this panel go away.
-
Progress Bar
- If something slow is happening
you may see a progress bar at the bottom of the screen while you wait.
Unless you are plotting several million points, you may not see this
at all.
For slow data loads, this will always be displayed.
For actions like actually drawing the plot and turning a blob into
a subset selection you can choose whether progress is shown using
the Show Plot Progress (
 )
button in the toolbar. It's nice to know that something's going on,
but it can be distracting; displaying progress also slows the plot down
a bit.
)
button in the toolbar. It's nice to know that something's going on,
but it can be distracting; displaying progress also slows the plot down
a bit.
The main toolbar at the top of the window
contains the following actions (repeated in the menus):
-
Float Controls
- Puts the Control Panel into a floating window rather than at
the bottom of the plot window, as described above.
Once floating, the control panel can be joined back to the main window
by clicking this button again.
-
 Draw Subset Blob
- Allows you to draw a region on the screen defining a new
Row Subset. When you have finished
drawing it, click this button again to indicate you're done.
See Appendix A.4.2.3.3 for more details.
-
 Subset From Visible
- Defines a new Row Subset
consisting of only the points which
are currently visible on the plotting surface.
See Appendix A.4.2.3.1 for more explanation.
-
 Replot
- Redraws the current plot. It is usually not necessary to
use this button, since if you change any of the plot characteristics
with the controls in this window the plot will be redrawn
automatically. However if you have changed the data, e.g. by
editing cells in the Data Window,
or by redefining a subset, the plot is not automatically redrawn.
Clicking this button redraws the plot taking account of any changes
to the table data.
-
 Rescale
- Rescales the axes of the current plot so that it contains all
the data points in the currently selected subsets.
By default the plot will be initially scaled like this,
but it it may have changed
because of changes in the subset selection or from zooming in or out.
-
 Lock Axes
- Usually, when the data plotted has changed significantly,
the axes are automatically rescaled so that all the points are visible.
The application makes a guess about when it's a good idea to do this
automatic rescaling. If you don't want it to auto-rescale, set this
toggle button, and it won't rescale unless it really has to.
This is not available for the Sky Plot.
-
 Lock Aux Range
- This controls when the Aux data range,
sometimes used to colour data points
(see the Aux Axis Control),
is updated to match the currently visible data.
By default, the range is updated dynamically as the plot changes,
for instance when you pan or zoom it,
so that the data range covered by the aux colour ramp matches the
range of the currently visible data.
But if this checkbox is checked, then the range is frozen to the
current value.
Data-sensitive updates to the aux range will then not be performed
until it's unchecked again.
It also affects some other dynamic ranging calculations such as
Auto-Scale sizes for plot forms
Size,
SizeXY,
Vector,
SkyVector,
Ellipse,
SkyEllipse,
XYCorr and
SkyCorr.
-
 Sketch Frames
- If selected causes intermediate "sketch" frames to be drawn when
navigating around very large plots.
For plots that take a long time (at least a non-negligable fraction
of a second) to draw, if this option is selected then when
navigating around it will paint intermediate frames based on a subsample
of the data rather than painting the whole plot at every step.
This can result in a somewhat flickering appearance, but it means
that frame updates happen more frequently, so it's a bit more responsive.
-
 Replot on Data Change
- Controls whether adjusting the value of global variables in the
Variables Window,
or redefining the expressions for Synthetic Columns or Row Subsets,
will cause immediate updates to the plot in this window.
If set true (the default) you can immediately see the effect of
adjusting global variables with the slider etc.
This is usually a good thing, but if there are very large or numerous
plots dependent on the changed values it can result in slowing things down.
By setting this false, the plot here will not automatically react to
variable/subset/column changes, but you can replot taking into
account the current variable values
using the Replot () button,
or by doing anything else that would cause a replot
such as a drag/zoom action.
-
 Export Plot
- Allows you to save the plot in a variety of graphics formats
using the Plot Export window.
The window menus offer an alternative way to perform
the actions available from the toolbar described above.
They also provide some additional options:
-
Layers menu
- This menu repeats the options available in the toolbar
from the Control Panel at the bottom of the window;
each one adds a new Layer Control of one of the available
types to the stack, or Removes ()
the currently selected control.
-
Plot menu
-
-
Show Plot Progress
- If selected (the default) a progress bar at the bottom
of the window is active
when large (slow) plots are in progress. This can be useful if you
are navigating round a very large plot so that you can see something
is happening rather than the application apparently just doing nothing.
On the other hand a flickering progress bar can be distracting.
Updating the progress bar may also slow the plot down a little.
-
 Show Navigation Graphics
- If selected (the default) navigation gestures like pan and zoom
cause lines to show up briefly on the plot to give you a clue
what navigation operation you have just performed.
If these get annoying you can turn them off by deselecting
this option.
-
Export menu
- This menu provides some options for exporting graphics and
data from the plot to external contexts:
-
Export Plot
- Saves the visible plot in an image format;
see Appendix A.4.2.6.
-
STILTS Command Window
- Displays a command which can be executed from outside TOPCAT
to reproduce the currently visible plot;
see Appendix A.4.3.4.
-
 Layer Data Import
-
 Layer Data Save
- These two sub-menus may or may not contain options.
Some plotted layer types (for instance 1d or 2d histograms)
generate table data as part of their
calculations that can be exported separately.
If one of these layers is currently plotted, then options may
appear in these menus.
The Import options retrieve the table and add it
to the list of tables currently loaded in TOPCAT;
the Save options can write the data directly to disk
using one of the supported table formats.
The following subsections explain some other features common to
all the plotting windows.
Next Previous Up Contents
Next: Navigation
Up: Plot Windows
Previous: Differences From Old-Style Plot Windows
TOPCAT - Tool for OPerations on Catalogues And Tables
Starlink User Note253
TOPCAT web page:
http://www.starlink.ac.uk/topcat/
Author email:
m.b.taylor@bristol.ac.uk
Mailing list:
topcat-user@jiscmail.ac.uk