Stacked Line Plot Style Editor
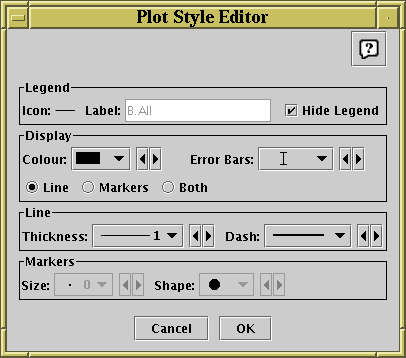
The default plotting style for the stacked lines plot is a simple black line for each graph. Since the plots typically do not overlap each other, this is in many cases suitable as it stands. However, you can configure the plotting style so that the points are plotted with markers as well as or instead of lines, and change the colours, marker shapes, line styles etc. The style for each row subset is displayed in a button to the right of its name in the bottom right of the plotting window. If you click this button the following dialogue will pop up which entables you to configure the plotting style.
Stacked Line Plot Style Editor
The Legend box defines how the selected set will
be identified in the legend which appears alongside the plot
(though the legend will only be visible if Show Legend
(![]() ) is on):
) is on):
The Display box defines how the markers plotted for each data point will appear:
The Line box defines how the lines joining the points will look. These controls will only be active if the Display selection is Line or Both.
The Markers box defines how markers at the data points will look. These controls will only be active if the Display selection is Markers or Both.
Any changes you make in this window are reflected in the plot straight away. If you click the OK button at the bottom, the window will disappear and the changes remain. If you click Cancel the window will disappear and any changes you made will be discarded.
You can also change all the plotting styles at once by using the Line Style menu in the stacked lines plot window. Here you can select a standard group of styles (e.g. dashed lines, coloured lines) for the plotted sets. Similarly, error styles can be changed all at once using the Error Style menu.