TOPCAT provides quite flexible graphical representation of symmetric or asymmetric errors in 1, 2 and 3 dimensions. The plots with error bar support are the 2D, 3D and spherical scatter plots and the stacked lines plot.
By default, error bar drawing is switched off. The simplest way to activate it is to use the relevant error bar button(s) in the data selector tool bar (the one below the plot). For the Cartesian (2D, 3D, lines) plots, some or all of the following buttons are present:
Here is a 2D plot in which symmetric X and asymmetric Y errors are being used:
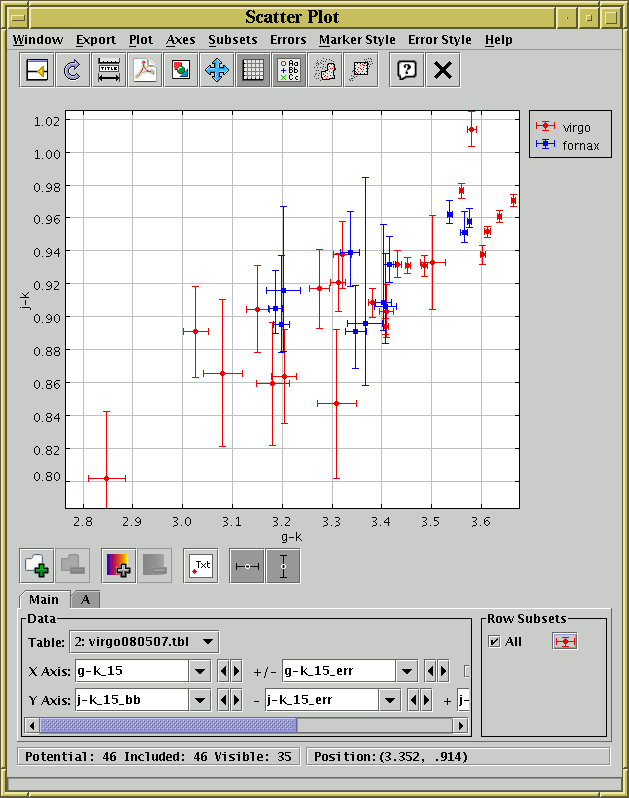
Plot window with symmetric X and asymmetric Y errors
You can see that with the error column selector, the panel has become too wide for the window so a scrollbar has appeared at the bottom - you can scroll this left and right or enlarge the window to see the parts that you need to.
For the spherical plot the following error toggle buttons are present:
If you want to use asymmetric or one-sided errors, use the options in the Errors menu instead of the toolbar buttons. For instance the options for X axis error bars in the 2D scatter plot are:
There are many options for the plotting style of one, two and three dimensional error bars, including capped and uncapped bars, crosshairs, ellipses and rectangles. This plotting style is controlled from the plot window's Style Editor window (see e.g. Appendix A.5.3.1), which can be viewed by clicking on the marker icon in the Row Subsets panel at the bottom right of the window. The available error bar styles will depend on which axes currently have errors; if none do, then the error bar selector will be disabled. You can also use the Error Style menu to change the error style for all the visible datasets at once.