Next Previous Up Contents
Next: Error Bars
Up: Common Features
Previous: Dataset Selectors
In general terms the axes on which the graphics are plotted are
defined by the datasets you have selected.
The axis labels are set from the column names or expressions chosen
for the Main dataset, and the ranges are determined
so that all the data from the chosen datasets can be seen.
However, these things can be adjusted manually.
The following features are available directly from the window for
configuring axis range:
-
X-Y Zoom
- In some of the windows
(2d scatter plot,
histogram and
density map),
you can change both axis ranges by zooming in or out
with the mouse on the plot surface itself.
To zoom in, place the mouse at the top left of the
region you want to examine, press the button, drag it to the
bottom right corner, and release the button. To zoom out, drag
up and left instead.
A box is drawn as you drag so you can see what you're doing.
-
Centre Zoom
- The 3d and
spherical plots allow you to zoom in
on the central part of the window. The 'active region' for
dragging is to the left or right of the plot (the region on the right
is rather thin, and does not include the width used by the legend).
When the pointer is in these regions, the mouse cursor symbol
should change to indicate that zooming can be done.
Drag down to zoom in and up to zoom out.
An easier alternative for zooming in the 3D windows is to use the
mouse wheel, if you have one: wheel forward to zoom in and
backward to zoom out.
-
Axis Zoom
- In some of the windows
(2d scatter plot,
histogram,
density map,
stacked lines)
you can modify the range on each axis independently by dragging the
mouse over where the axis is drawn. The 'active region' for dragging
is just below the X axis and just to the left of the Y axis, in the
region where the numeric and text labels are written.
When the pointer is in one of these regions, the mouse cursor
symbol should change to indicate that zooming can be done.
As for the X-Y Zoom, drag left-to-right or up-to-down
to zoom in and right-to-left or down-to-up to zoom out.
-
Auxiliary (Colour) Axis Zoom
- When Auxilary Axes are in use, you can
zoom in and out of them by dragging up and down on the colour bar
to the right of the plot, in the same way as for a normal Axis
Zoom above.
-
 Rescale
- If you find you're zoomed to a region you don't want to be in,
you can use the Rescale toolbar button to return to the default
scale (full coverage). Note this affects any auxiliary axes
as well as the spatial ones.
Some windows may have per-axis rescale buttons too
(
 ,
,  ).
).
For more control over axis range and labelling, use the
Configure Axes and Title ( ) toolbar button,
which will pop up a dialogue like the following:
) toolbar button,
which will pop up a dialogue like the following:
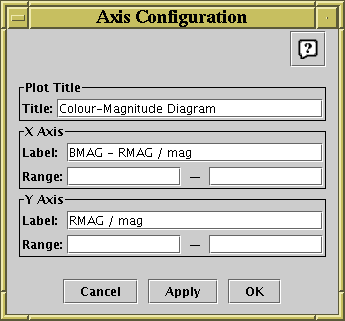
Axis Configuration Dialogue for 2-d axes
You can fill in these values for each axis as follows:
-
Label
- For each axis the label box contains the text used to annotate
the axis in the plot. By default this is the same as the text
in the Main dataset column selector
(usually a column name), followed by the units if known.
However, you can change it by typing whatever text you like.
-
Range
- The range boxes allow you to specify the lower and upper limits
of each axis. By default these are blank, meaning that the plot
will size its axes so that all the data can be seen. However, if
you fill in one or both of the boxes with a suitable numeric value,
the lower/upper bound will be fixed at that. Note that the lower
bound (left box) must be numerically less than the upper bound
(right box).
Both values are reset if the plot's axis is changed (a new column or
expression is selected for the Main dataset), or if the range is
reset in some other way (e.g. by zooming).
The plot title may also be set in the Plot Title panel
of this window:
-
Title
- Any text entered here will be displayed at the top of the plot
to provide a title.
Next Previous Up Contents
Next: Error Bars
Up: Common Features
Previous: Dataset Selectors
TOPCAT - Tool for OPerations on Catalogues And Tables
Starlink User Note253
TOPCAT web page:
http://www.starlink.ac.uk/topcat/
Author email:
m.b.taylor@bristol.ac.uk
Mailing list:
topcat-user@jiscmail.ac.uk