When quantities are plotted in one of the graphics windows it becomes easy to see groupings of the data which might not otherwise be apparent; a cluster of (X,Y) points representing a group of rows may correspond to a physically meaningful grouping of objects which you would like to treat separately elsewhere in the program, for instance by calculating statistics on just these rows, writing them out to a new table, or plotting them in a different colour on graphs with different coordinates. This is easily accomplished by creating a new Row Subset containing the grouped points, and the graphics windows provide ways of doing this.
In some of the plots
(Histogram
2d Scatter plot
Density map and
Spherical plot)
you can set the axis ranges (either manually or by zooming with the
mouse - see Appendix A.5.1.2)
so that only the points you want to identify are visible,
and then click the
Subset From Visible toolbar button
(the icon is ![]() ,
, ![]() or
or ![]() depending on the plot type).
This defines a subset consisting of all the
points that are visible on the current plot.
This is only useful if the group you are interested in
corresponds to a rectangular region in the plotting space.
depending on the plot type).
This defines a subset consisting of all the
points that are visible on the current plot.
This is only useful if the group you are interested in
corresponds to a rectangular region in the plotting space.
A more flexible way is to draw a region or regions
on the plot which identify the points you are interested in.
To do this, hit the
Draw Subset Region (![]() )
toolbar button. Having done this, you can drag the mouse around
on the plot (keep the left mouse button down while you move)
to encircle the points that you're interested in.
As you do so, a translucent grey blob will be left behind -
anything inside the
blob will end up in the subset. You can draw one or many blobs,
which may be overlapping or not. If you make a mistake while
drawing a sequence of blobs, you can click the right mouse button,
and the most recently added blob will disappear.
When you're in this region-drawing mode,
you can't zoom or resize the window or change the characteristics
of the plot, and the Draw Subset Region button
appears with a tick over it (
)
toolbar button. Having done this, you can drag the mouse around
on the plot (keep the left mouse button down while you move)
to encircle the points that you're interested in.
As you do so, a translucent grey blob will be left behind -
anything inside the
blob will end up in the subset. You can draw one or many blobs,
which may be overlapping or not. If you make a mistake while
drawing a sequence of blobs, you can click the right mouse button,
and the most recently added blob will disappear.
When you're in this region-drawing mode,
you can't zoom or resize the window or change the characteristics
of the plot, and the Draw Subset Region button
appears with a tick over it (![]() ) to remind you
you're in it. Here's what the plot looks like while you're drawing:
) to remind you
you're in it. Here's what the plot looks like while you're drawing:
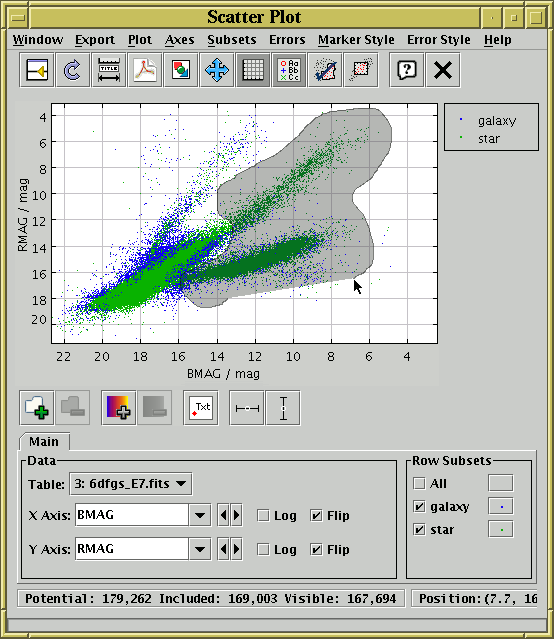
Region-Drawing Mode
When you're happy with the region you've defined, click the
![]() toolbar button again.
toolbar button again.
In either case, when you have indicated that you want to define a new row subset, a dialogue box will pop up to ask you its name. As described in Section 3.1.1, it's a good idea to use a name which is just composed of letters, numbers and underscores. You can optionally select a subset name which has been used before from the list, which will overwrite the former contents of that subset. When you enter a name and hit the OK button, the new subset will be created and the points in it will be shown straight away on the plot using a new symbol. As usual, you can toggle whether the points in this subset are displayed using the Row Subsets box at the bottom of the Plot Window.